
Ecommerce sites capitalize on the convenience of online shopping, but they also face stiff competition in a crowded marketplace. That means if you are an online retailer, your website should be fully optimized, and your marketing channels well-curated in order to increase the likelihood of a customer completing the sale. So how do you know what on your website is working well and what could use some TLC? That’s what Google Analytics ecommerce tracking is for.
Google Analytics allows online retailers to set up ecommerce tracking by adding tracking codes to the relevant pages on the website. This step can be completed in-house if your team has coding knowledge, or outsourced to your web developer. At Pacific54, setting up, auditing, and optimizing Google Analytics and tracking tags is a top priority when launching or optimizing marketing campaigns for our clients.
After enabling Google Analytics ecommerce tracking, you can use the dashboard to learn more about audience behavior, sales revenue, and the effectiveness of your marketing campaigns. With so much information at your fingertips, it can be hard to sort out exactly which metrics should be your focus.
As a starting point, here are the key ecommerce metrics you should be looking for, why you should care about each metric, and where to find them in the Google Analytics dashboard.
1) Review Transactions to Understand How Your Website is Converting
According to Google Analytics, transactions refer to the total number of completed purchases on your website.
Where to Find Transaction Metrics in Google Analytics:
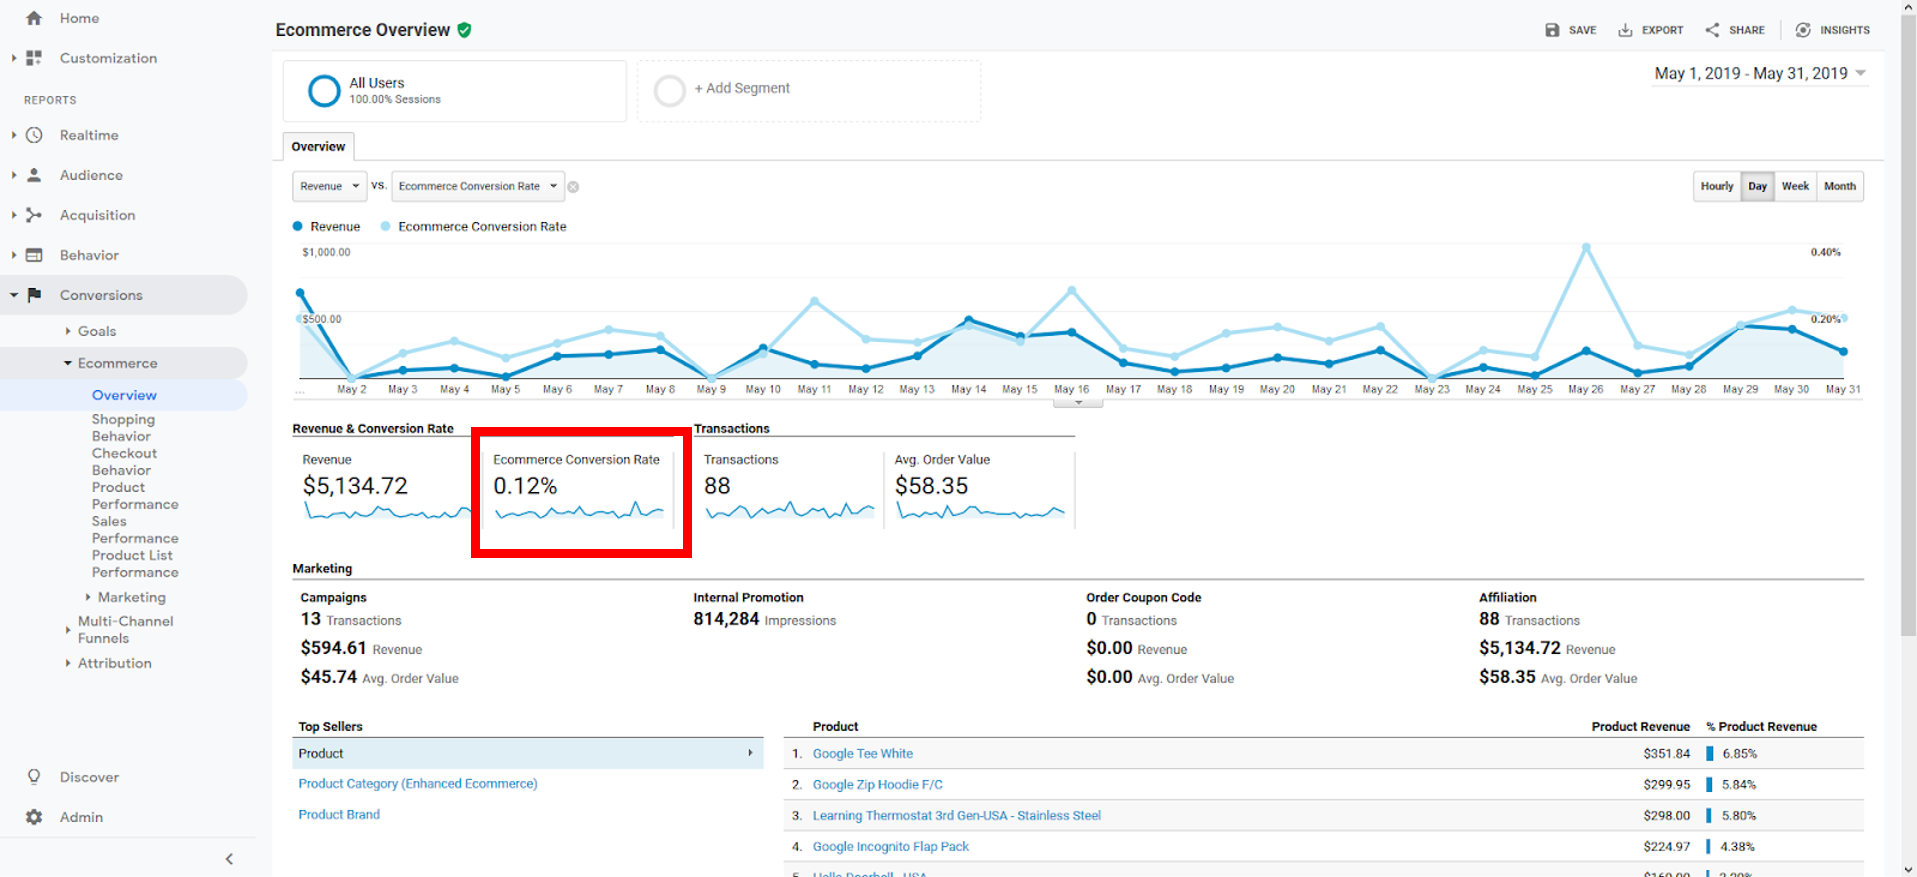
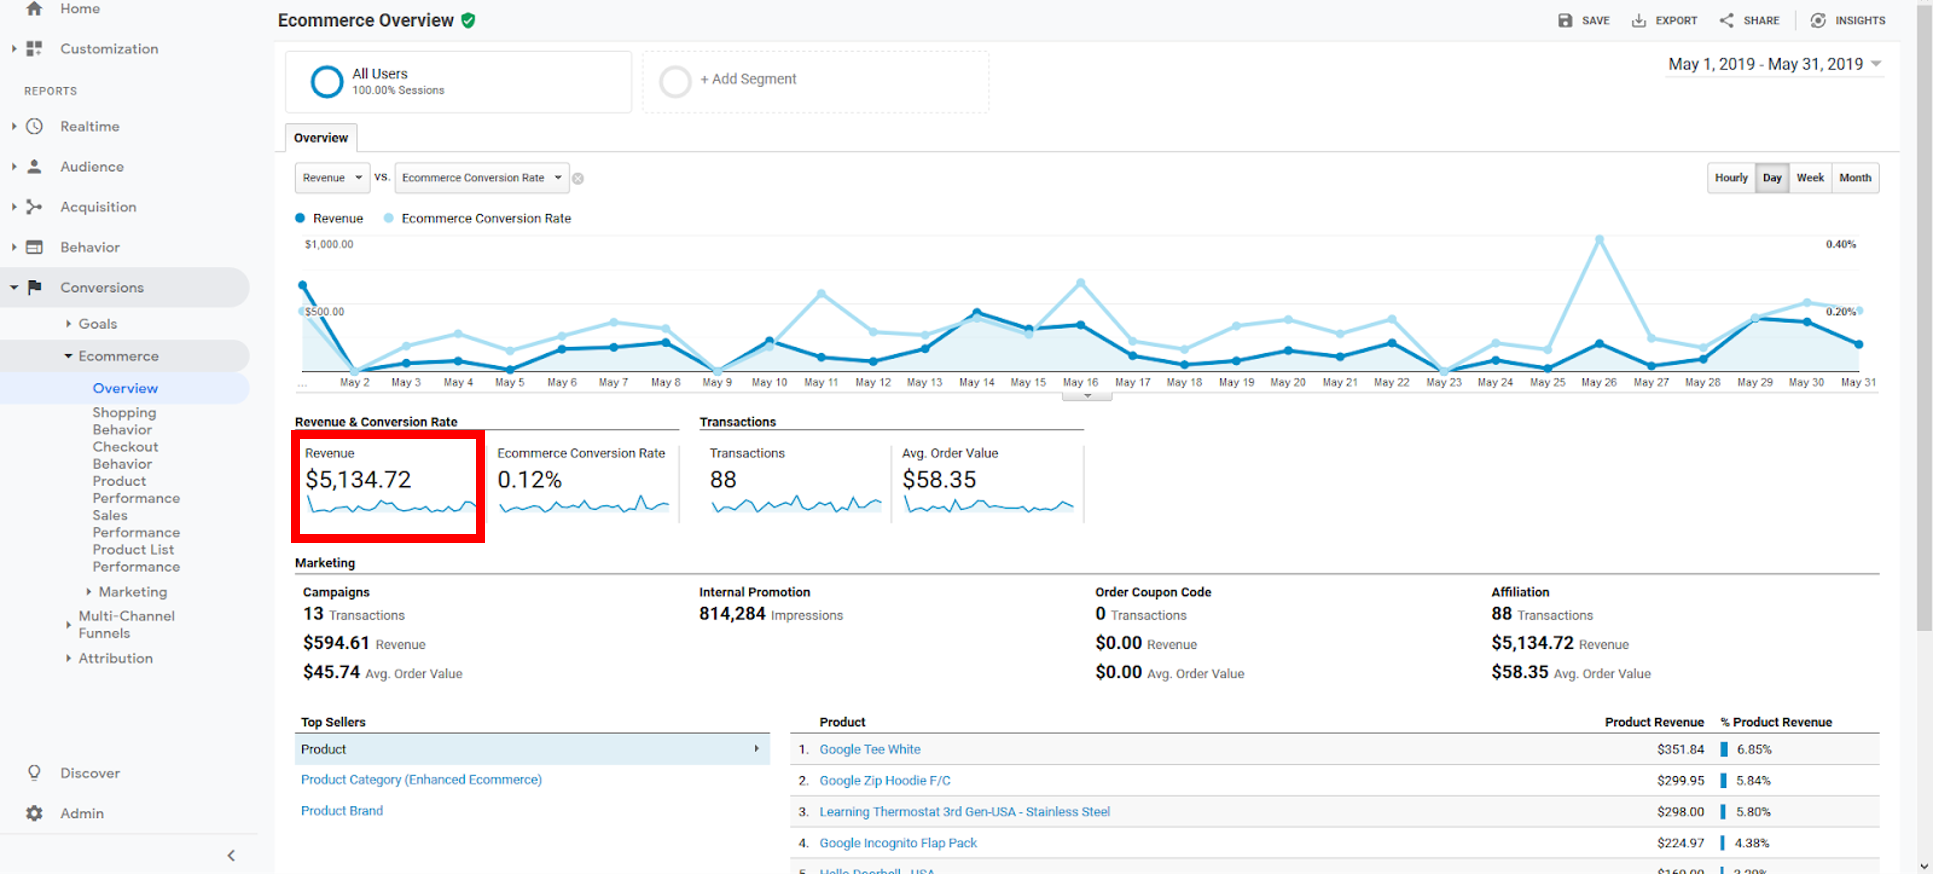
After clicking on the Conversions Ecommerce Overview tab in the far left column, the main dashboard will show the number of transactions for the specified time period. In the example below, from May 1 to May 31, there were 88 transactions in total.

How to Analyze Transaction Metrics:
When analyzing Transactions, what you want to do is find patterns in the number of transactions that happen per period. For instance, you can compare transactions based on different weeks, months, or quarters to find patterns.
Maybe some days of the week generate a higher number of transactions than others. In that case, you can consider strategies to increase the transactions for those slow days. For example, you can send additional promotional emails.
Comparing transactions between different sources such as social vs organic can also provide interesting insights into what traffic sources generate the most transactions. To do this, just compare segments with 2 different sources.
In the example below, you can see how the number of Transactions and Average Order Value compare between the ‘Organic Traffic’ and ‘Social Media Traffic’ segments.

To make sure your Transactions are being recorded correctly, compare them with your website transactions. If there is a significant difference between the transactions on your site vs the transactions reported in Google Analytics, check with your developer to make sure everything is set up correctly.
Why Transaction Metrics Are Important:
Reviewing your transaction in Google Analytics is useful to get a better idea of how your website is performing regarding sales. Since transaction metrics tell you how many people successfully completed a transaction, it is best to look at transaction metrics in conjunction with other ecommerce metrics such as traffic and “add to cart” to see how the sales funnel narrows as website visitors go through the customer journey.
If a lot of visitors are adding items to a cart but few are completing transactions, brainstorm ways to re-engage with those potential customers.
span {
display: block;
}
.newsletter-form .text > span + span {
margin-top: 7.5px;
}
.newsletter-form .text .green {
color:
font-family: “Montserrat”, sans-serif;
font-size: 22.45px;
font-weight: 900;
}
.newsletter-form .form {
flex-grow: 1;
margin-left: 25px;
}
.newsletter-form .form form {
display: flex;
height: 100%;
}
.newsletter-form .form button[type=”submit”] {
transition: background-color 250ms linear;
background-color:
background-image: url( “https://www.pacific54.com/wp-content/uploads/2019/02/airplane-bg.png” );
background-position: 52.5% center;
background-repeat: no-repeat;
background-size: 20px auto;
border-radius: 3px;
border: 0px;
height: 50px;
margin-left: 15px;
width: 70px;
cursor: pointer;
}
.newsletter-form .form button[type=”submit”]:hover {
background-color:
}
/* Material Button */
div.full-input {
position: relative;
width: 100%;
padding: 15px;
background-color:
box-sizing: border-box;
height: 50px;
min-width:200px;
}
div.input {
display: block;
position: relative;
width: 100%;
margin: 0px;
height: 20px;
box-sizing: border-box;
}
div.full-input:before,
div.full-input:after {
bottom: 0px;
content: “”;
display: block;
height: 1px;
left: 0px;
position: absolute;
transform: translate3d( 0, 0, 0 );
}
div.full-input:before {
background-color:
width: 100%;
}
div.full-input:after {
transition: background-color 250ms linear, width 250ms linear;
background-color: transparent;
width: 0%;
}
div.input * {
font-family: “Roboto”, sans-serif;
font-size: 14px;
font-weight: 300;
}
div.input span,
div.input input[type=email] {
background-color: transparent;
border: 0px;
height: inherit;
left: 0px;
margin: 0px;
padding: 0px;
position: absolute;
width: 100%;
}
div.input input[type=email] {
outline: none;
}
div.input span {
height: inherit;
line-height: 20px;
top: 0px;
}
div.full-input.loaded div.input,
div.full-input.loaded div.input span {
transition: all 125ms linear;
}
div.full-input.is-focused:after {
background-color:
width: 100%;
}
div.full-input div.input {
transform: translateY( 0px );
}
div.full-input.has-text div.input,
div.full-input.is-focused div.input {
transform: translateY( 7.5px );
}
div.full-input.has-text div.input span,
div.full-input.is-focused div.input span {
font-size: 10px;
height: 10px;
line-height: 10px;
top: -10px;
}
@media ( min-width: 900px ) and ( max-width: 1099px ) {
.newsletter-form {
flex-direction: column;
}
.newsletter-form > div {
flex-grow: 1;
width: 100%;
margin-left: 0px !important;
}
.newsletter-form > div + div {
margin-top: 15px;
}
}
@media ( max-width: 799px ) {
.newsletter-form {
flex-direction: column;
}
.newsletter-form > div {
flex-grow: 1;
width: 100%;
margin-left: 0px !important;
}
.newsletter-form > div + div {
margin-top: 15px;
}
.newsletter-form span.green {
font-size: 18px !important;
}
}]]>
2) Look at Traffic Metrics to Analyze Website Visitors
Traffic refers to how many people visit your website and which external sources brought them there.
Where to Find Traffic Metrics in Google Analytics:
Traffic information will be displayed under Acquisition All Traffic Source/Medium, as shown below.

How to Analyze Traffic Metrics:
“Users” (how many visitors), “sessions” (how many separate visits), and “pageviews” (how many individual web pages are visited) are all different ways to analyze traffic. You should include a few of these traffic metrics in your biweekly or monthly reporting to track how traffic varies according to sales cycles, marketing campaign activity, and other patterns that would affect the bottom line.
An added benefit of the traffic dashboard is how much it can tell you about where the traffic comes from. Google Analytics groups traffic into a few different categories: “direct” traffic (when a user types the URL directly into the browser), “referring” traffic (when a user is redirected from another site to your page), or “search engine” traffic (further categorizes as “organic” for non-paid search or “cpc” for paid search).
More specifically, Google Analytics can tell you which specific websites have directed users to your website. Whenever you launch a marketing campaign designed to drive traffic to your site, you should include a UTM link with information that will enable Google Analytics to match each hit on your website with the appropriate marketing channel and campaign. Without setting up UTM links, the traffic reporting will be too vague to use in marketing strategy.
Why Traffic Metrics Are Important:
Understanding your main traffic sources will help you determine which marketing channels have the greatest impact and which should not be renewed for your next campaign. Over a longer period of time, you can also see if certain times of the year (such as summer or holidays) cause a spike in web traffic and pivot your marketing spend accordingly.
3) Understand Conversion Rate for How Many People Are Browsing vs. Buying
The “conversion rate” refers to the percentage of people who complete a goal, such as making a purchase, after visiting your website.
Where to Find Conversion Rate Metrics in Google Analytics:
The dedicated section for ecommerce tracking can be found under the “Conversions” tab in the left sidebar. Navigate to Conversions Ecommerce Overview, and find the percentage under “Revenue Conversion Rate.” In the screenshot below, the conversion rate is 0.12%.
How to Analyze Conversion Rate:
In ecommerce, conversion rate usually refers to how many people make a purchase after visiting your website. In Google Analytics, the overall conversion rate is how many people complete one of the goals you configured (which may include signing up for a newsletter, adding an item to the cart, or making a purchase).
If you want to focus exclusively on how many people converted by making a purchase, you will need to analyze the conversion rate only with your ecommerce goal. This can be done on the ecommerce dashboard or by selecting the ecommerce filter under “Goal Completions” on other tables in Google Analytics.
You can also see conversion rates in different countries by adding additional filters or creating advanced segments.
Keep in mind that Google Analytics only measures one goal completion per session, so it can skew the rate if a user makes a purchase, and then buys a second item they realized they forgot the first time around.
Why Conversion Rate Metrics Are Important:
How does the number of people looking at your website compare to the number of people who made a purchase? Conversion rate expresses this as a percentage rather than gross numbers, so it is easier to compare over time to see any major changes in how successful your site is in generating sales.
4) See How Many Visitors Added an Item to their Cart
On an ecommerce site, customers usually browse for products they want to purchase and add them to their “cart” before submitting payment. This is measured as “Add to Cart.”
Where to Find Add to Cart Metrics in Google Analytics:
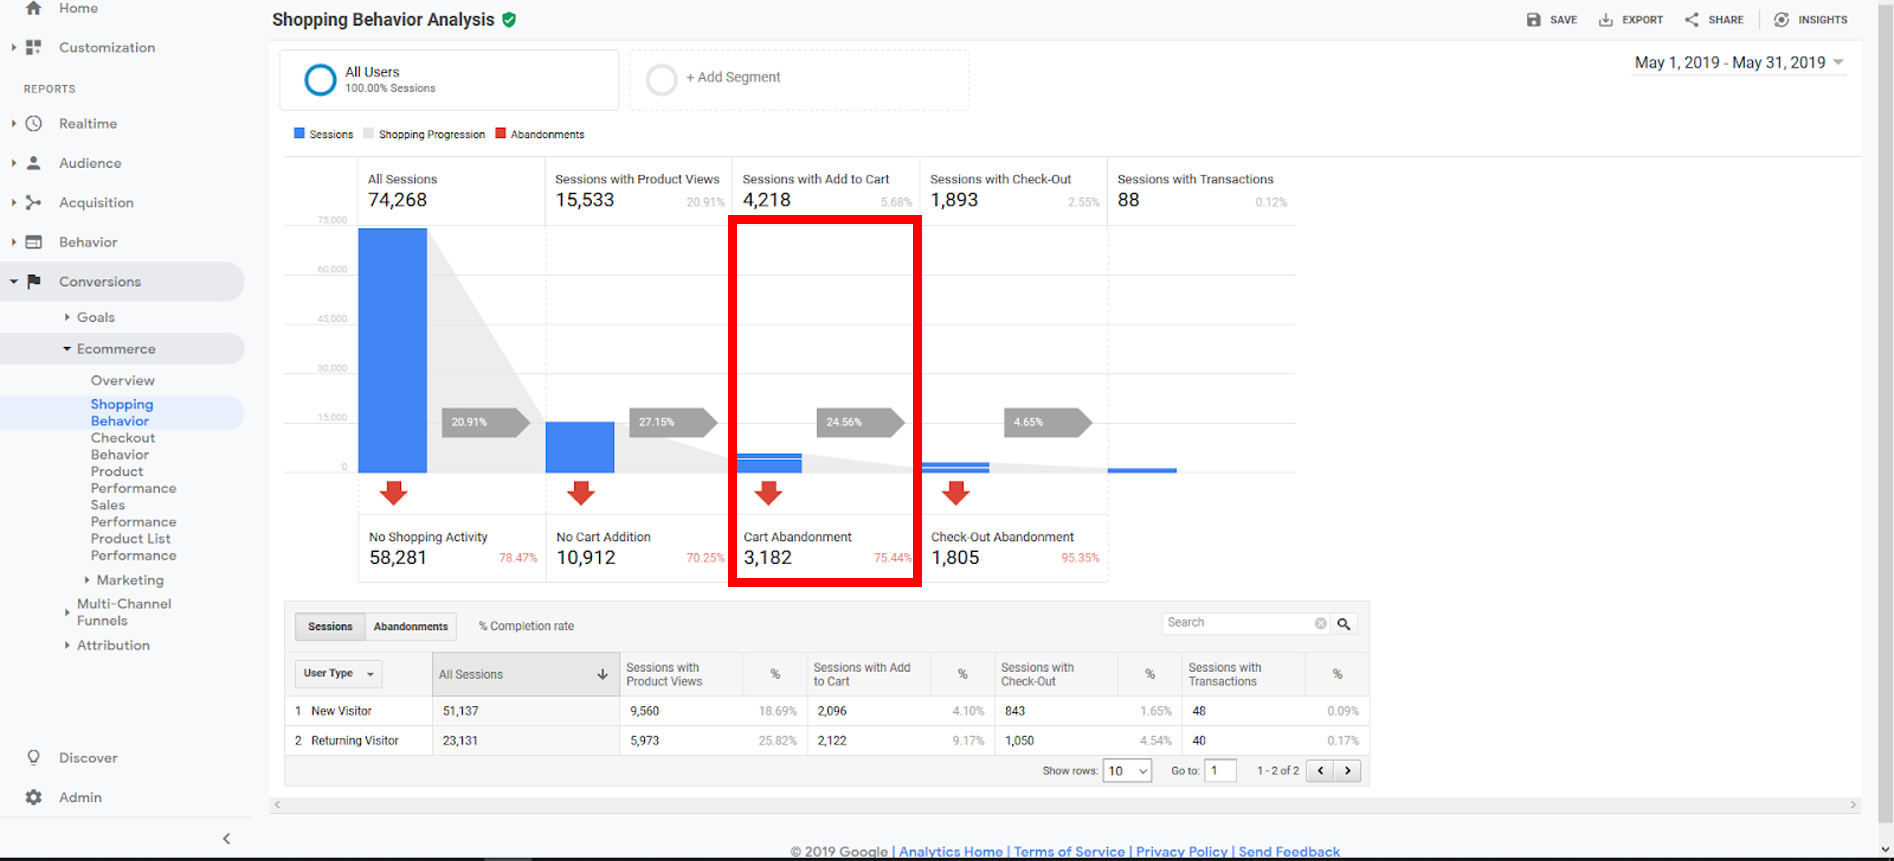
The number of sessions that include the “Add to Cart” action can be found under Conversions Ecommerce Shopping Behavior.

How to Analyze Add to Cart Metrics:
“Add to Cart” is one of the key ecommerce metrics that signal to a retailer the number of customers who intend to buy, whether or not they complete the purchase. You can expect the “Add to Cart” metric to be higher than the transaction metric, but lower than the “all sessions” metric. To set up Add to Cart correctly, you will need to add this as an “event action” since Google Analytics would not track it otherwise.
Why Add to Cart Metrics Are Important:
Add to Cart metrics show how many visitors were interested enough in a product to add it to their shopping cart. This shows an additional engagement step in the sales funnel.
5) Review Cart Abandonment Rate for Missed Opportunities
Not everyone who adds an item to their cart will complete the purchase. The percentage of people who log out of the website and still have an item in their cart is known as the “cart abandonment rate.”
Where to Find Cart Abandonment Rate Metrics in Google Analytics:
To view cart abandonment rate in Google Analytics ecommerce tracking, follow the navigation path Conversions Ecommerce Shopping Behavior.
How to Analyze Cart Abandonment Metrics:
When setting up the goal completions of making a purchase, you also have the ability to analyze shopping behavior expressed as a visualization, like in the screenshot above. The difference between the number of people who added an item to the cart and the number of people who completed the transaction is the number of people who abandoned the cart.
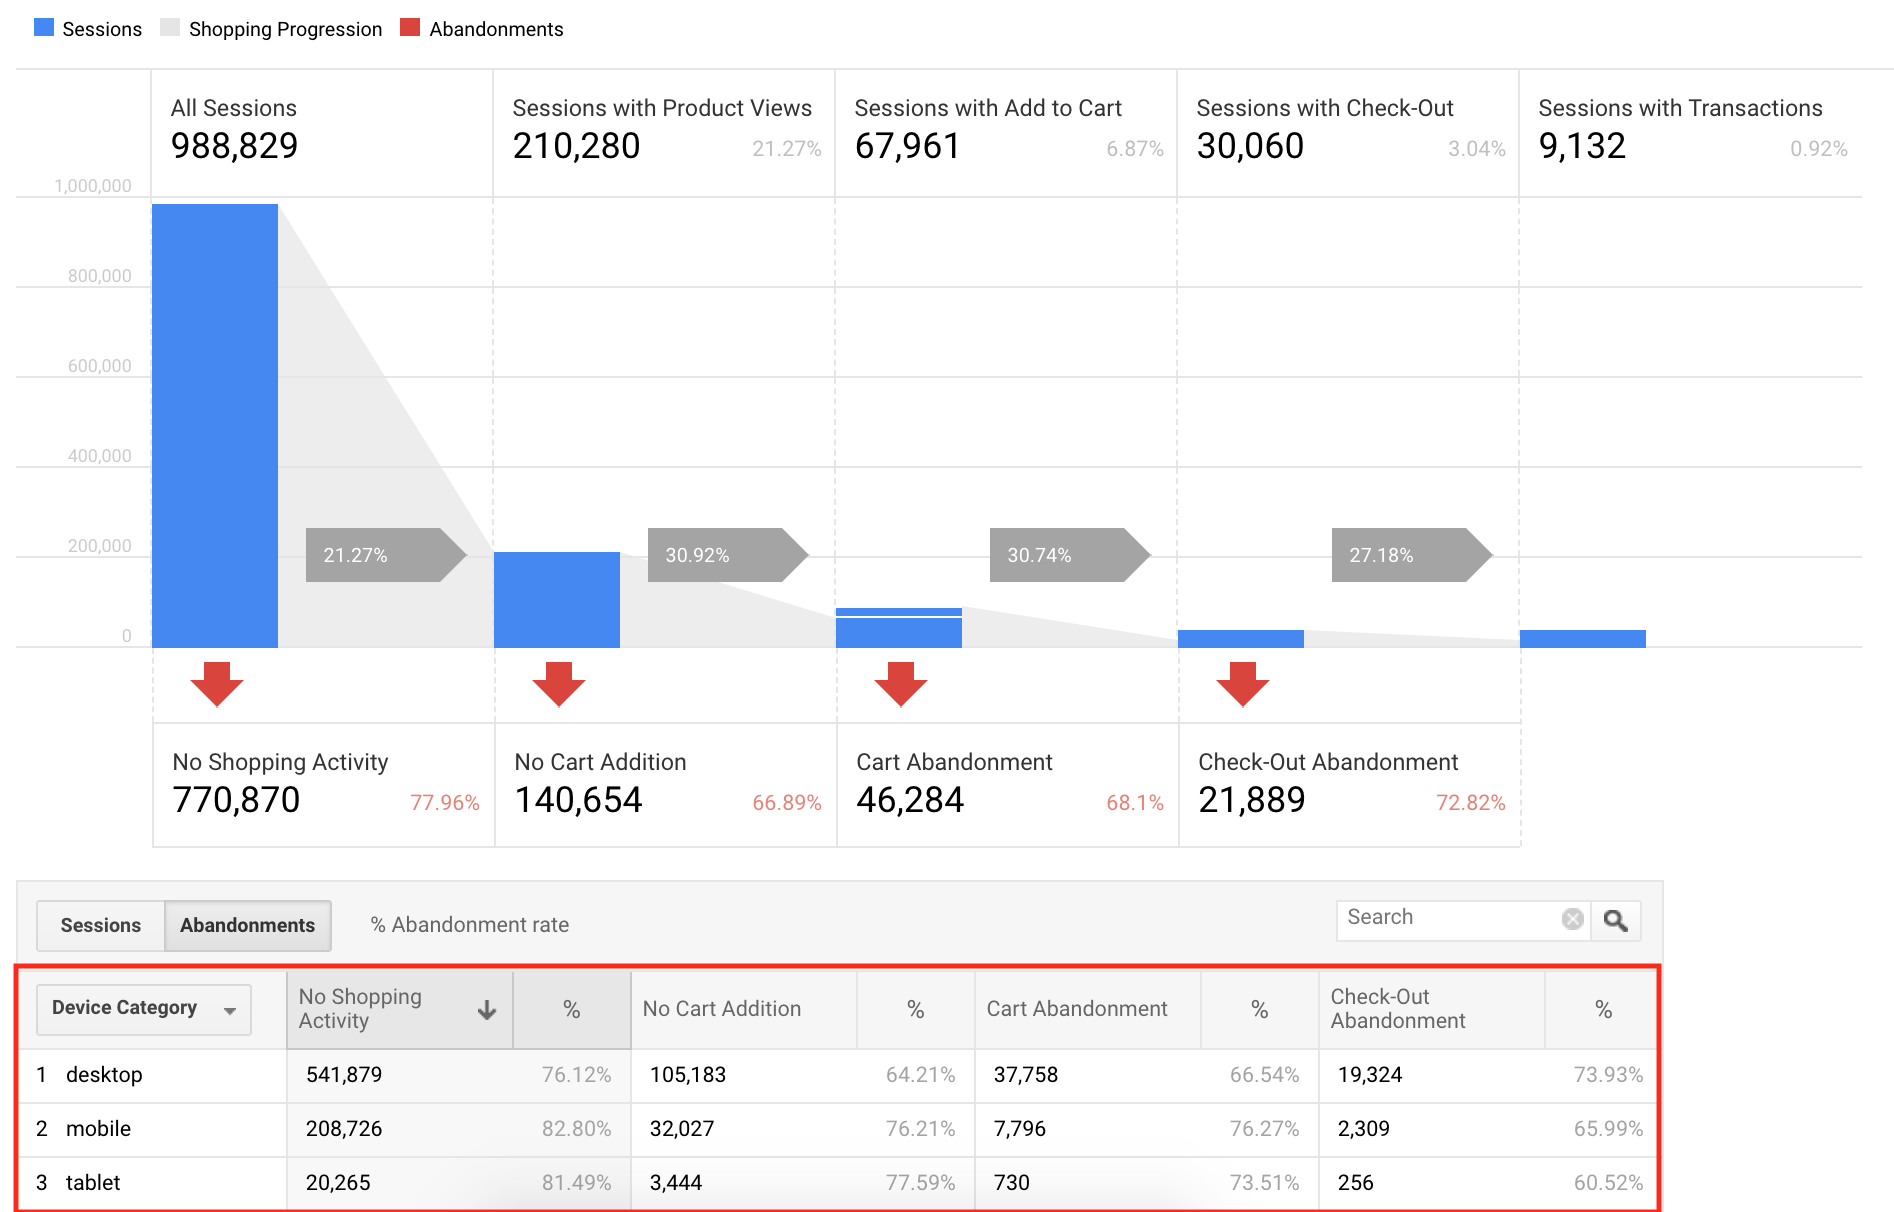
You can dive deeper into the data by looking at dimensions, such as device type or location, to compare cart abandonment rates across different demographics or areas of interest. You can also take this information and launch a user testing initiative to see if there are other ways to improve the website and reduce dropoff.
The dropdown will allow you to choose from several different dimensions that you can use to sort and organize your data. Here is an example of Abandonments sorted by device category.
Why Cart Abandonment Metrics Are Important:
Understanding the dropoff between adding to the cart and abandoning the cart can help you better optimize your website for completing purchases, such as if the account creation process takes too long or there’s an issue on the payment page. You can also use cart abandonment information to send a pop-up or email notification to website visitors, offering a discount or reminding them that an item is still in their cart.
6) Use Bounce Rate to Improve Site Relevance
The bounce rate refers to the percentage of visitors to a website who leave the site after viewing only one page.
Where to Find Bounce Rate Metrics in Google Analytics:
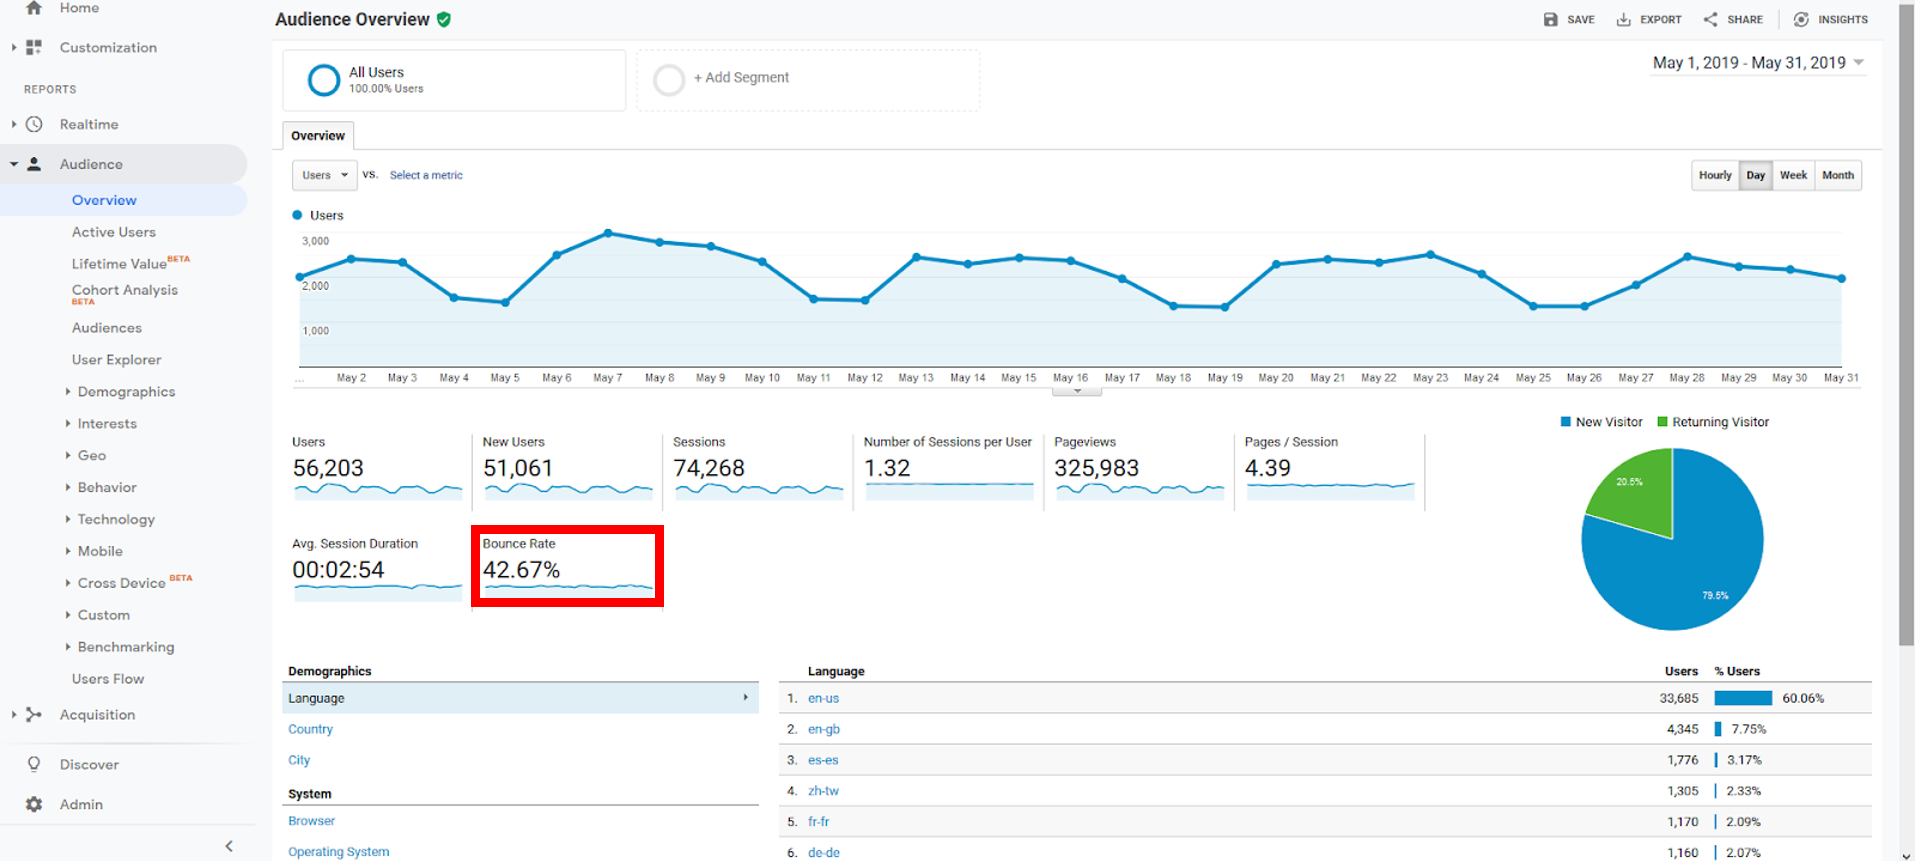
The overall website bounce rate can be found in the Audience Overview section of Google Analytics.
How to Analyze Bounce Rate Metrics:
Unlike many of the other metrics on this list, the bounce rate calculation is done automatically by Google Analytics and does not require additional set-up. Ideally, you are looking for a low bounce rate. In ecommerce, users will usually need to navigate to multiple pages in order to browse for products, add to a cart, and check out. Digging deeper, you can analyze bounce rates for individual web pages or by traffic Source/Medium to understand which parts of your marketing are working and which are not.
Why Bounce Rate Metrics Are Important:
A high bounce rate might mean that website visitors are not interested in your product or do not believe that the page they started on is relevant to them. If bounce rates are consistently high, look at the web pages that most visitors see first and optimize it.
Note that a high bounce rate may be an indication that you’re ranking for keywords that are not related to your page, or that your meta titles and meta descriptions are not relevant to the page. For example, let’s say you are DSW, which sells heels, sneakers, and sandals for men and women. A user is looking for sneakers for men and notices DSW organic listing:

What do you think the user will expect to see in the page? Yep, men’s sneakers. If the user suddenly clicks on the listing and goes to a page for women’s sneakers, there would be a disconnect and confusion, pushing the user to leave the site. Therefore, creating a bounce on the site.
7) Review Revenue in Real Time
The main goal for an ecommerce retailer is to make money, so many key ecommerce metrics are directly involved with revenue.
Where to Find Revenue Metrics in Google Analytics:
In addition to showing the conversion rate, the Conversions Ecommerce Overview tab highlights how much revenue has been generated in the specified time period. In the screenshot below, this ecommerce store generated $5,134.72 over a one month period.
How to Analyze Revenue Metrics:
Ecommerce tracking must be set up in order to track revenue. If the sales number from your accounting team does not match the number shown in Google Analytics, make sure the developer configured the ecommerce setting correctly and added tracking codes to web pages where needed.
Google Analytics revenue metrics are in real-time. If you wanted, you could check on an hourly basis to see how much money has been generated from website sales. If you just launched a new marketing campaign, you will want to keep a close eye on this number to see if there’s a big jump in revenue.
Why Revenue Metrics Are Important:
While metrics like transactions and conversion rates show how many conversions were generated, revenue shows how much money your site made. The 88 transactions may have been for 88 $1 key chains, or 88 pairs of $100 sneakers. Looking at revenue in conjunction with the other metrics gives a more complete picture of how your site is performing.
span {
display: block;
}
.newsletter-form .text > span + span {
margin-top: 7.5px;
}
.newsletter-form .text .green {
color:
font-family: “Montserrat”, sans-serif;
font-size: 22.45px;
font-weight: 900;
}
.newsletter-form .form {
flex-grow: 1;
margin-left: 25px;
}
.newsletter-form .form form {
display: flex;
height: 100%;
}
.newsletter-form .form button[type=”submit”] {
transition: background-color 250ms linear;
background-color:
background-image: url( “https://www.pacific54.com/wp-content/uploads/2019/02/airplane-bg.png” );
background-position: 52.5% center;
background-repeat: no-repeat;
background-size: 20px auto;
border-radius: 3px;
border: 0px;
height: 50px;
margin-left: 15px;
width: 70px;
cursor: pointer;
}
.newsletter-form .form button[type=”submit”]:hover {
background-color:
}
/* Material Button */
div.full-input {
position: relative;
width: 100%;
padding: 15px;
background-color:
box-sizing: border-box;
height: 50px;
min-width:200px;
}
div.input {
display: block;
position: relative;
width: 100%;
margin: 0px;
height: 20px;
box-sizing: border-box;
}
div.full-input:before,
div.full-input:after {
bottom: 0px;
content: “”;
display: block;
height: 1px;
left: 0px;
position: absolute;
transform: translate3d( 0, 0, 0 );
}
div.full-input:before {
background-color:
width: 100%;
}
div.full-input:after {
transition: background-color 250ms linear, width 250ms linear;
background-color: transparent;
width: 0%;
}
div.input * {
font-family: “Roboto”, sans-serif;
font-size: 14px;
font-weight: 300;
}
div.input span,
div.input input[type=email] {
background-color: transparent;
border: 0px;
height: inherit;
left: 0px;
margin: 0px;
padding: 0px;
position: absolute;
width: 100%;
}
div.input input[type=email] {
outline: none;
}
div.input span {
height: inherit;
line-height: 20px;
top: 0px;
}
div.full-input.loaded div.input,
div.full-input.loaded div.input span {
transition: all 125ms linear;
}
div.full-input.is-focused:after {
background-color:
width: 100%;
}
div.full-input div.input {
transform: translateY( 0px );
}
div.full-input.has-text div.input,
div.full-input.is-focused div.input {
transform: translateY( 7.5px );
}
div.full-input.has-text div.input span,
div.full-input.is-focused div.input span {
font-size: 10px;
height: 10px;
line-height: 10px;
top: -10px;
}
@media ( min-width: 900px ) and ( max-width: 1099px ) {
.newsletter-form {
flex-direction: column;
}
.newsletter-form > div {
flex-grow: 1;
width: 100%;
margin-left: 0px !important;
}
.newsletter-form > div + div {
margin-top: 15px;
}
}
@media ( max-width: 799px ) {
.newsletter-form {
flex-direction: column;
}
.newsletter-form > div {
flex-grow: 1;
width: 100%;
margin-left: 0px !important;
}
.newsletter-form > div + div {
margin-top: 15px;
}
.newsletter-form span.green {
font-size: 18px !important;
}
}]]>
8) Understand Revenue by Traffic Source to Optimize Marketing Spend
As with many other key ecommerce metrics, you can break down a larger number by traffic source to see which channels are most effective.
Where to Find Revenue by Traffic Source Metrics in Google Analytics:
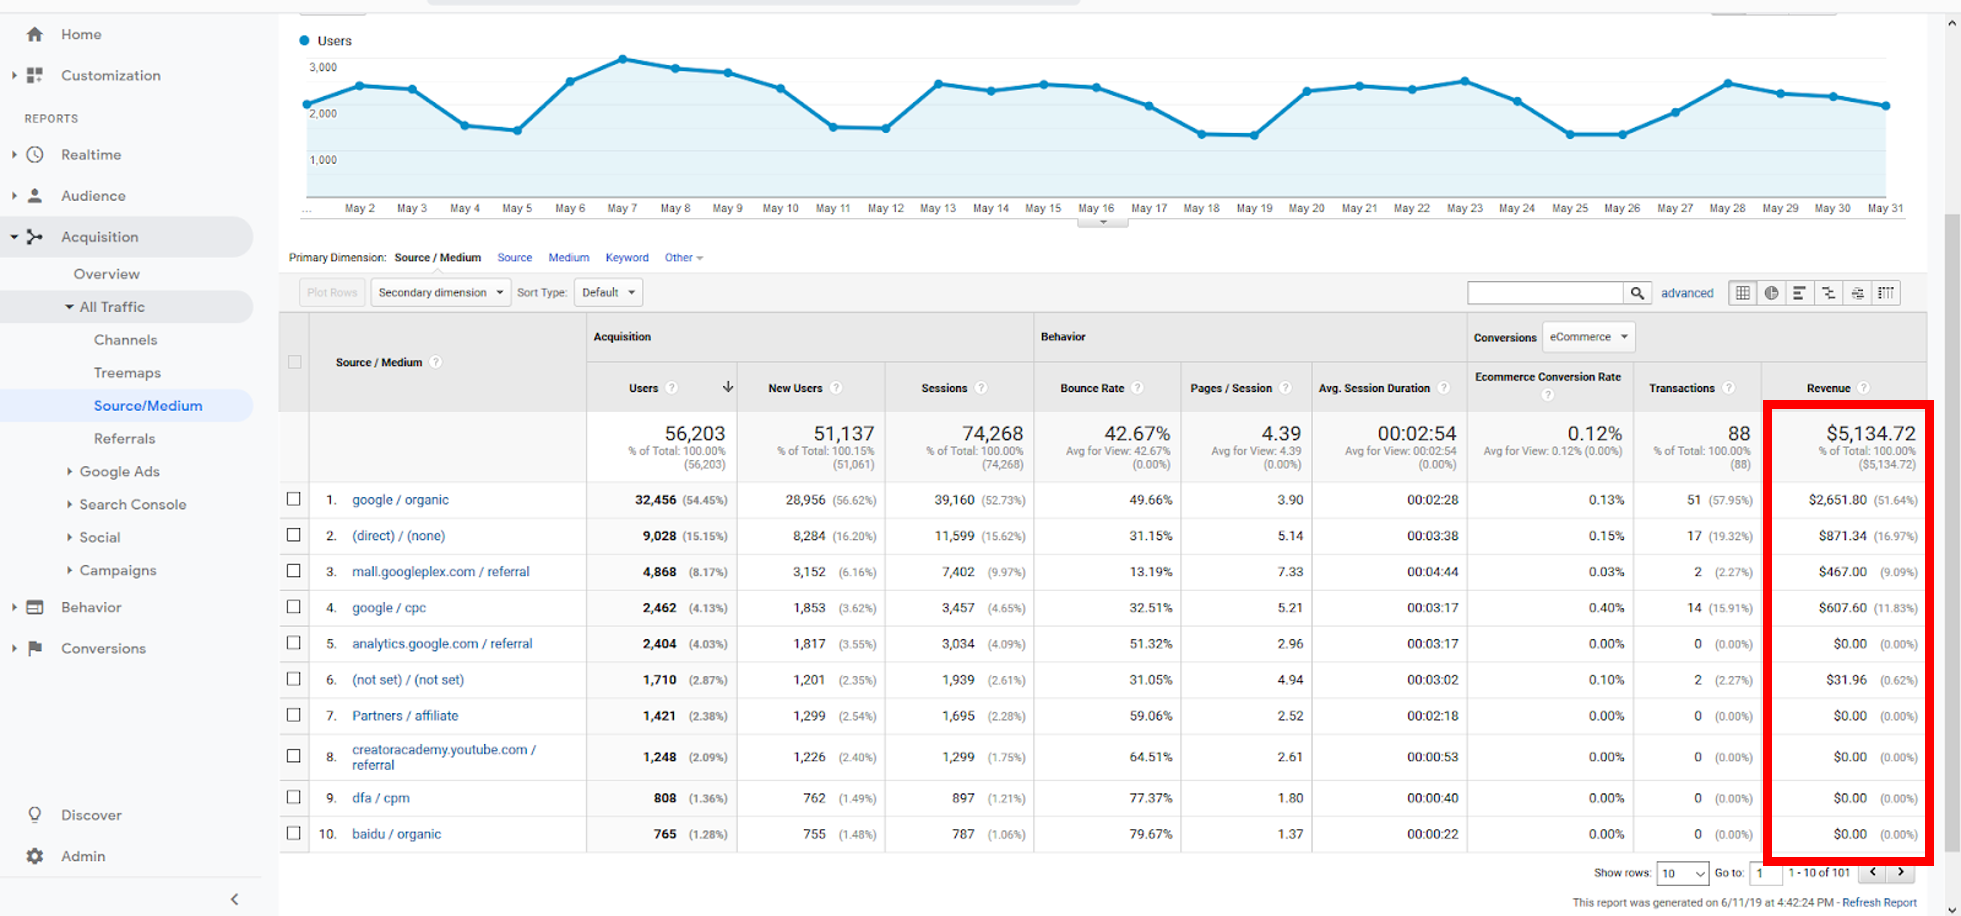
After the ecommerce tracking is set up, you can also visit the Acquisition All Traffic Source/Medium tab to see how much revenue has been generated by each marketing or traffic channel. In the table below, look at the “revenue” column on the far right. As you can see, the top traffic source is google / organic, which generated $2,661.80, or about half of the ecommerce revenue.
How to Analyze Revenue by Traffic Source Metrics:
If you have enabled ecommerce tracking and set up your UTM links for your marketing campaigns, this dashboard should give you an accurate picture of how much money each traffic source is generating for your company.
The default setting for Google Analytics Source/Medium is to list traffic sources in descending order by the number of users. However, you might have traffic sources that didn’t have as many users, but still generated more revenue.
Instead, sort by revenue in descending order so you can see up front how much each source brought in. You can also compare the revenue number to the number of transactions. You may find that one traffic source brought in only a few transactions, but a higher overall revenue per transaction.
Why Revenue by Traffic Source Metrics Are Important:
The overall revenue number can be helpful for high-level analytics, but it’s looking at the granular, traffic source level that enables your marketing team to pivot as needed. If one source is generating significantly more revenue than others, then you can optimize your advertising dollars by focusing on the more lucrative channels.
9) Track the Percentage of Returning Visitors
Some visitors will peruse your ecommerce site, and then leave and come back. These are known as “returning visitors.”
Where to Find Returning Visitor Metrics in Google Analytics:
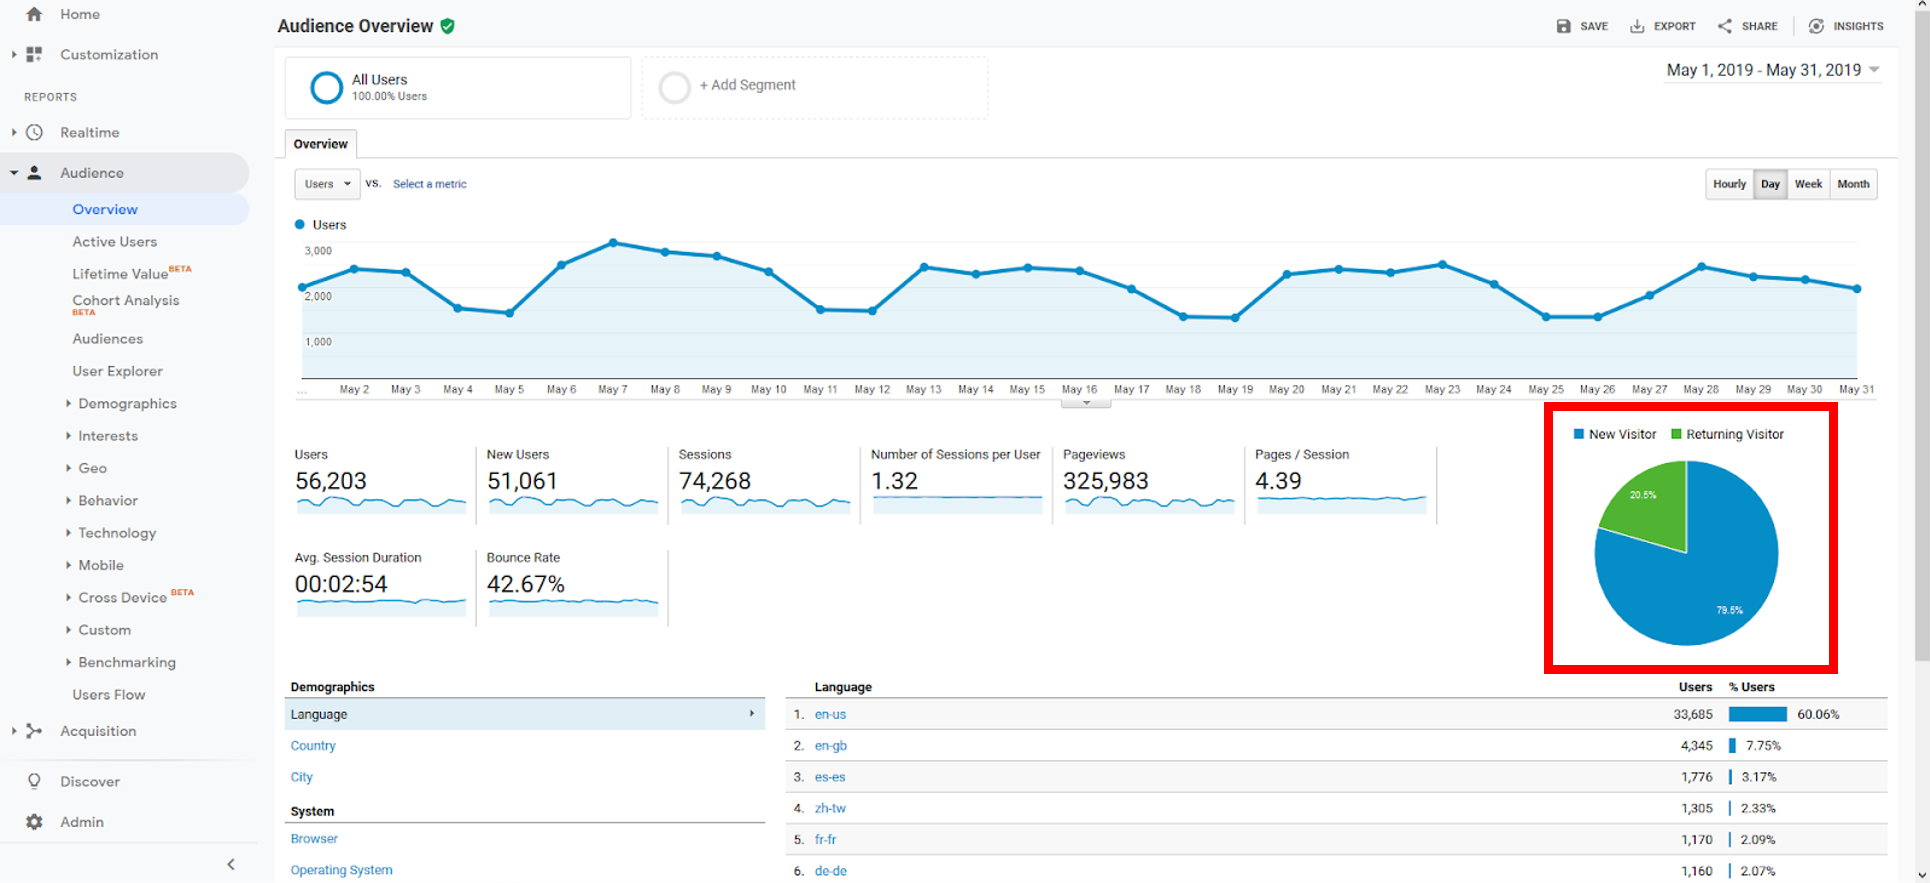
The percentage of returning visitors can be found in the Audience Overview tab, in the blue and green pie chart on the far right. In the screenshot below, 20.5% of all website visitors are classified as returning visitors.
How to Analyze Returning Visitor Metrics:
The first time someone visits your site, Google Analytics assigns their IP address a unique ID so it can track when users return. This is all done automatically by Google Analytics. A few limitations of this metric are that users might use different devices and be counted twice, or they might clear cookies from their browser and therefore be tracked as a new user when they visit your site again.
While this number will have some variation, it is still accurate enough to be used for detecting patterns over time. Since most users will not convert on the first visit to a website, having a higher number of returning visitors is important.
Why Returning Visitor Metrics Are Important:
This is a great metric to measure visitor loyalty or interest, and when compared to new visitors, it can give you a good snapshot of what marketing initiatives you can improve. For example, paid advertising and SEO can encourage new visits, while email newsletters and social media can encourage return visits.
10) Calculate Customer Acquisition Cost, Especially for Each Channel
Customer acquisition cost refers to how much money a business spends in order to convince a customer to buy a service or a product.
Where to Find Customer Acquisition Cost Metrics in Google Analytics:
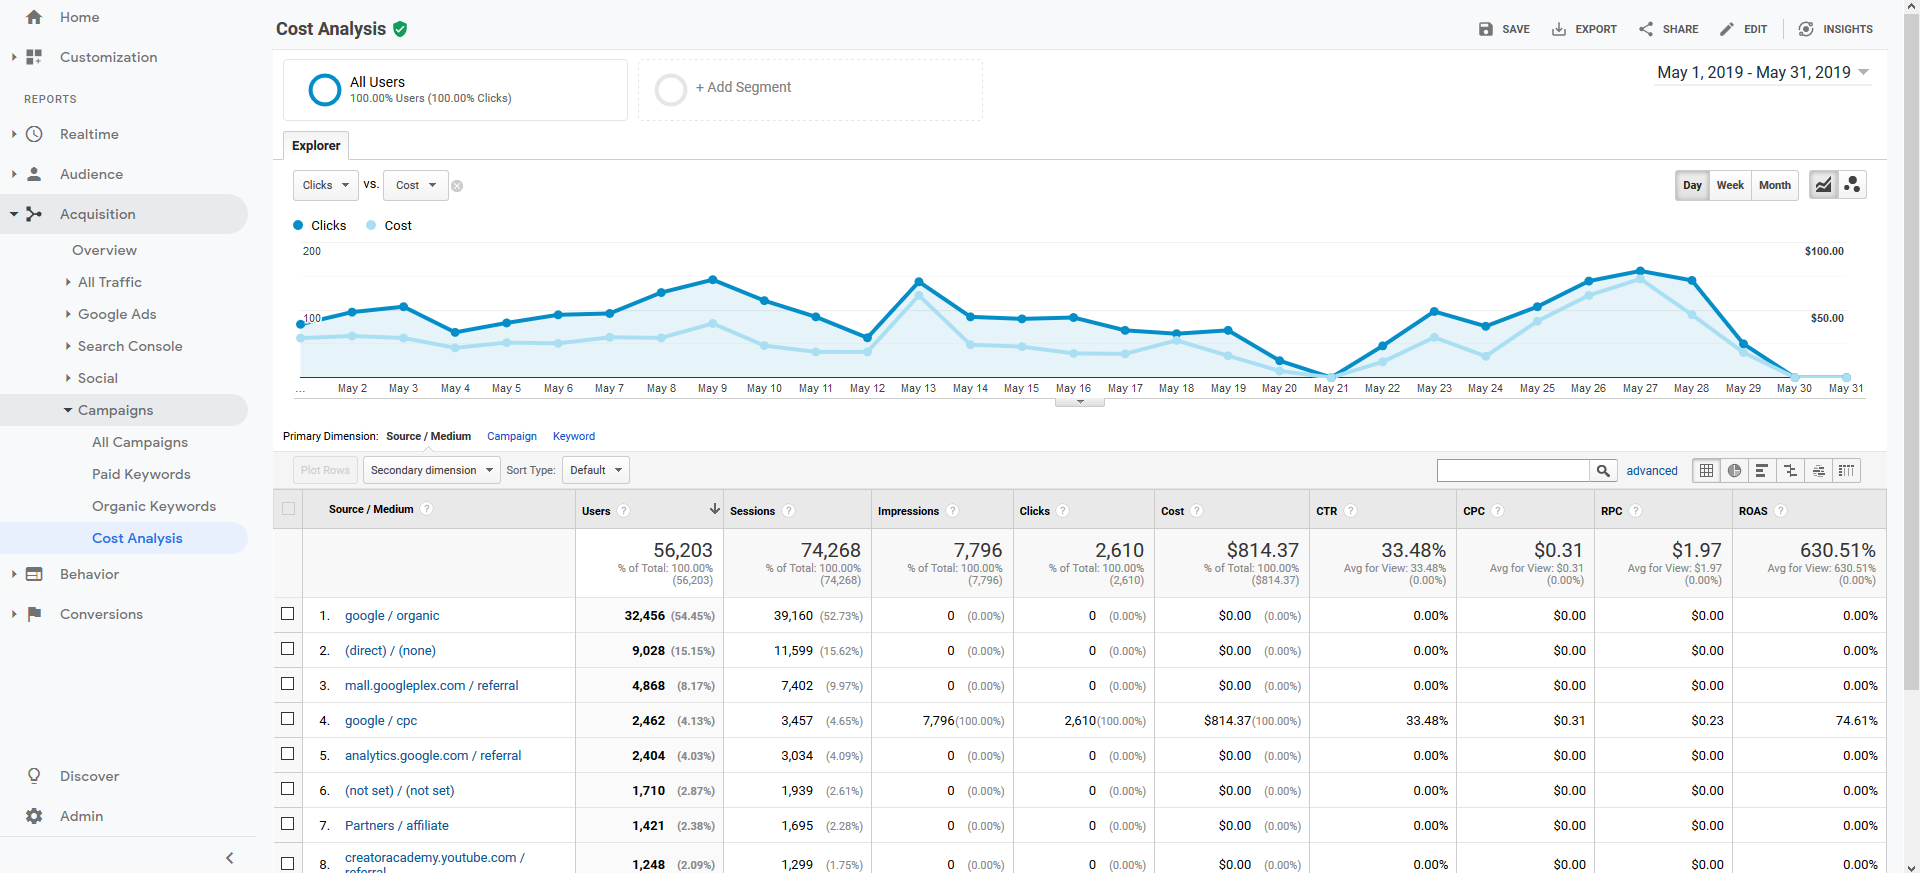
Google Analytics generates a customer acquisition cost report under Acquisition Campaigns Cost Analysis.
How to Analyze Customer Acquisition Cost Metrics:
Customer acquisition cost is best analyzed by channel. In the table above, each Source/Medium is matched with its associated advertising spend, click-through rate, cost-per-click, revenue-per-click, and return on advertising spend (ROAS).
Compare these metrics to see which channel has the lowest customer acquisition cost or best ROI. To have the most accurate picture of this metric, make sure all traffic sources to your website are connected to a UTM link and that all relevant ecommerce pages have the appropriate tracking code to capture all financial data.
Why Customer Acquisition Cost Metrics Are Important:
Not every channel is effective for acquiring new customers. That’s why it’s important to understand your customer acquisition cost at the source level so you can find which channels are at the sweet spot of having a fairly low customer acquisition cost and higher revenue per customer.
—
Which of these Google Analytics ecommerce metrics do you use in your reporting? If you are interested in learning more about how to optimize your ecommerce site or measure its effectiveness, contact Pacific54 today to see how we can help.