
Niche ecommerce companies should focus on their value proposition. Fellow contributor Pamela Hazelton provides excellent advice on the subject in “Value Propositions Increase Interest and Sales.” I will add one point to her article: The value proposition should address a sustainable competitive advantage that the company will have over competitors — current or future.
Once the company defines it, the value proposition should be measured. Data from Google Analytics can be enlightening. It may confirm that the company’s customers align with the value proposition, but it may also identify reasons to adjust strategy.
Example Value Proposition
Here is a real example. When I started my company, Greek Internet Market, my partners and I assumed we would target mostly Greek Americans who were interested in purchasing Greek food items online because they could not find the products locally or they preferred the convenience of ecommerce.
Thus our original target market was primarily Greek Americans and, secondarily, all Americans who enjoyed Greek food.
Our original value proposition emphasized customer service:
Outstanding communication through the entire shopping experience and focus on building lifetime relationships with our customers.
We based our value proposition on our knowledge that sellers of Greek food were notorious for providing poor customer service and were not willing to change their ways. However, soon after we started selling online, we began measuring our assumptions and made two big discoveries.
- Roughly half of our customers were non-Greek. We measured this informally by reviewing customer names from orders — not in Google Analytics. (We could have added a survey during checkout asking if the customer was Greek or not, and imported the data into Google Analytics.)
- Our customers were mostly urban. We did not see a higher proportion of orders coming from rural places that would not have Greek groceries available. We obtained this data in Google Analytics using the City report, at Audience Geo Location and select “City” as the primary dimension.
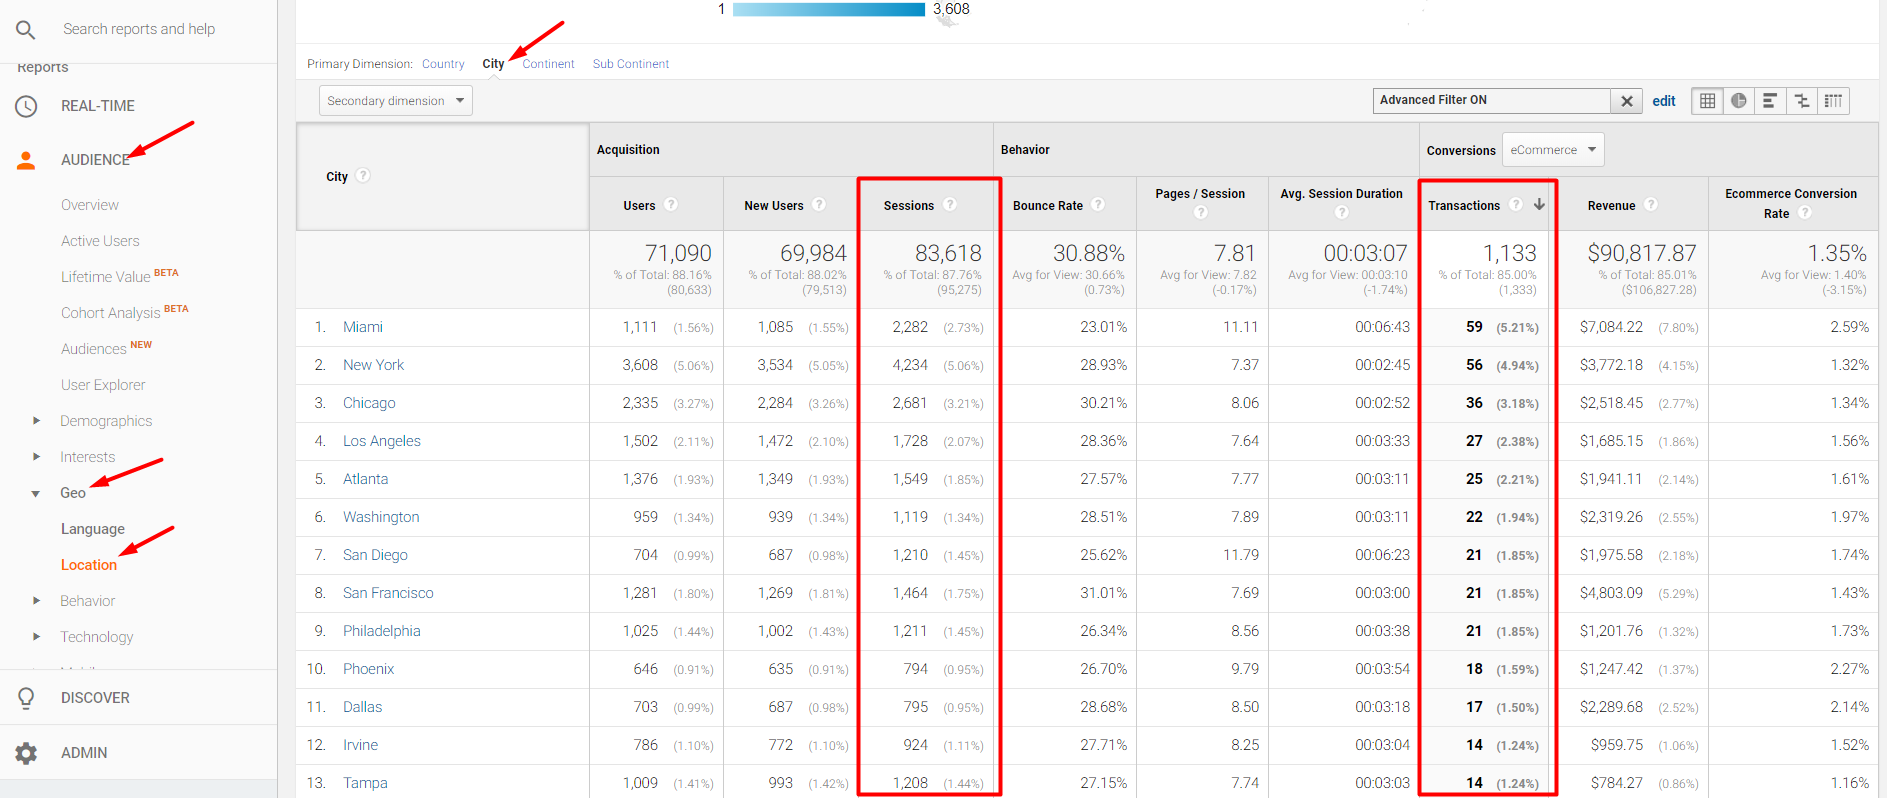
Most sales came from customers in cities, not rural areas, as reported by Google Analytics. Click image to enlarge.
We also used sales data to identify repeat customers to determine if our customer-focused approach was working. This data did not come from Google Analytics at the time because it didn’t have this capability.
However, we can now report repeat customer behavior by creating an Advanced Segment — click the link, then save to your View in Google Analytics — and running the report at Conversions Ecommerce Overview.
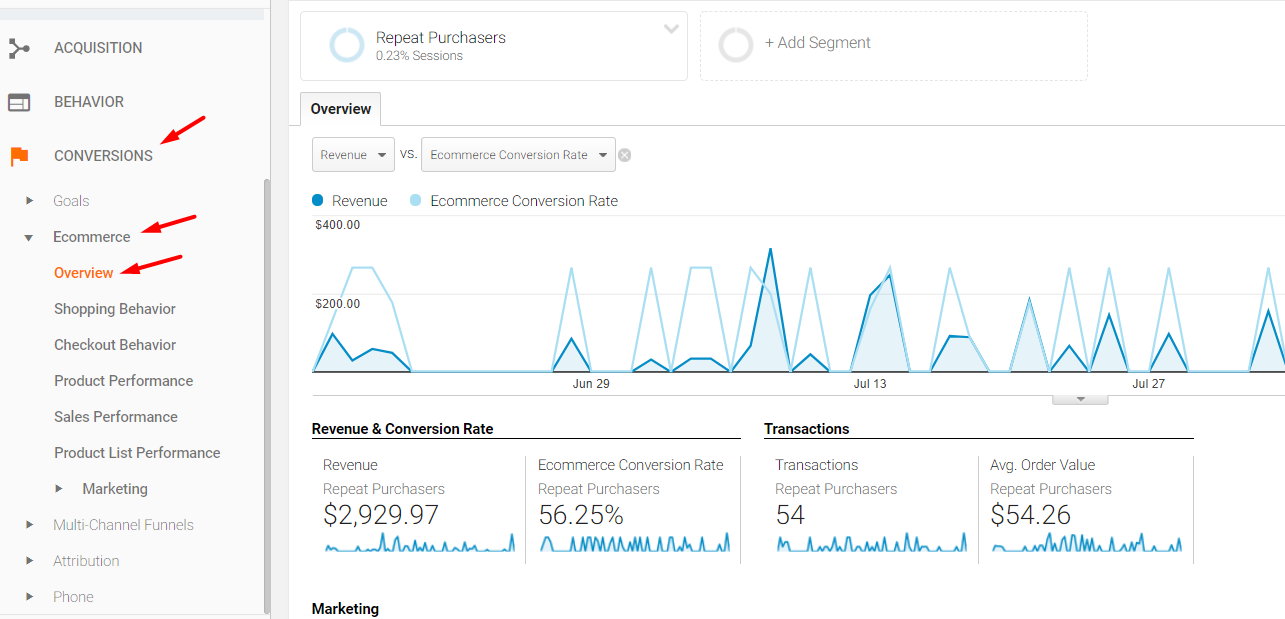
In Google Analytics, Conversions Ecommerce Overview reports repeat customer revenue. Click image to enlarge.
We learned that a very small percentage of sales came from repeat customers. That was not promising! One of our assumptions was that outstanding customer service would drive repeat buyers. But we missed a critical value proposition for our target market: lowest price.
We’ve since tested the “lowest price” value proposition over the years. We found that it did drive repeat sales, but it was not sustainable because many competitors accept poor profit margins at levels where we were unwilling to compete.
Over time, we used email marketing and other methods of communication, along with incentives and promotions, to drive repeat sales. We abandoned competing on price and instead focused on service enhancements, such as:
- Rapid delivery,
- Generous return policy,
- Loyalty incentives,
- Free shipping for orders that exceed a threshold.
All of those enhancements supported our original value proposition: outstanding customer service. But they also alienated many Greek Americans (half of our target market) who were knowledgeable of our products and were unwilling to sacrifice the lowest price for our shopping experience.
We instead grew a more loyal following of Greek and non-Greek customers that appreciated our approach to selling. We carved out our niche.
How to Measure
If your target market is a certain gender or age range, Google Analytics can report the percentage of your traffic with those demographics. Go to Audience Demographics Overview to report age and gender. However, not all visitors are included in this report. The percentage that is included is at the top right — “43.83 of total users” in the example below.
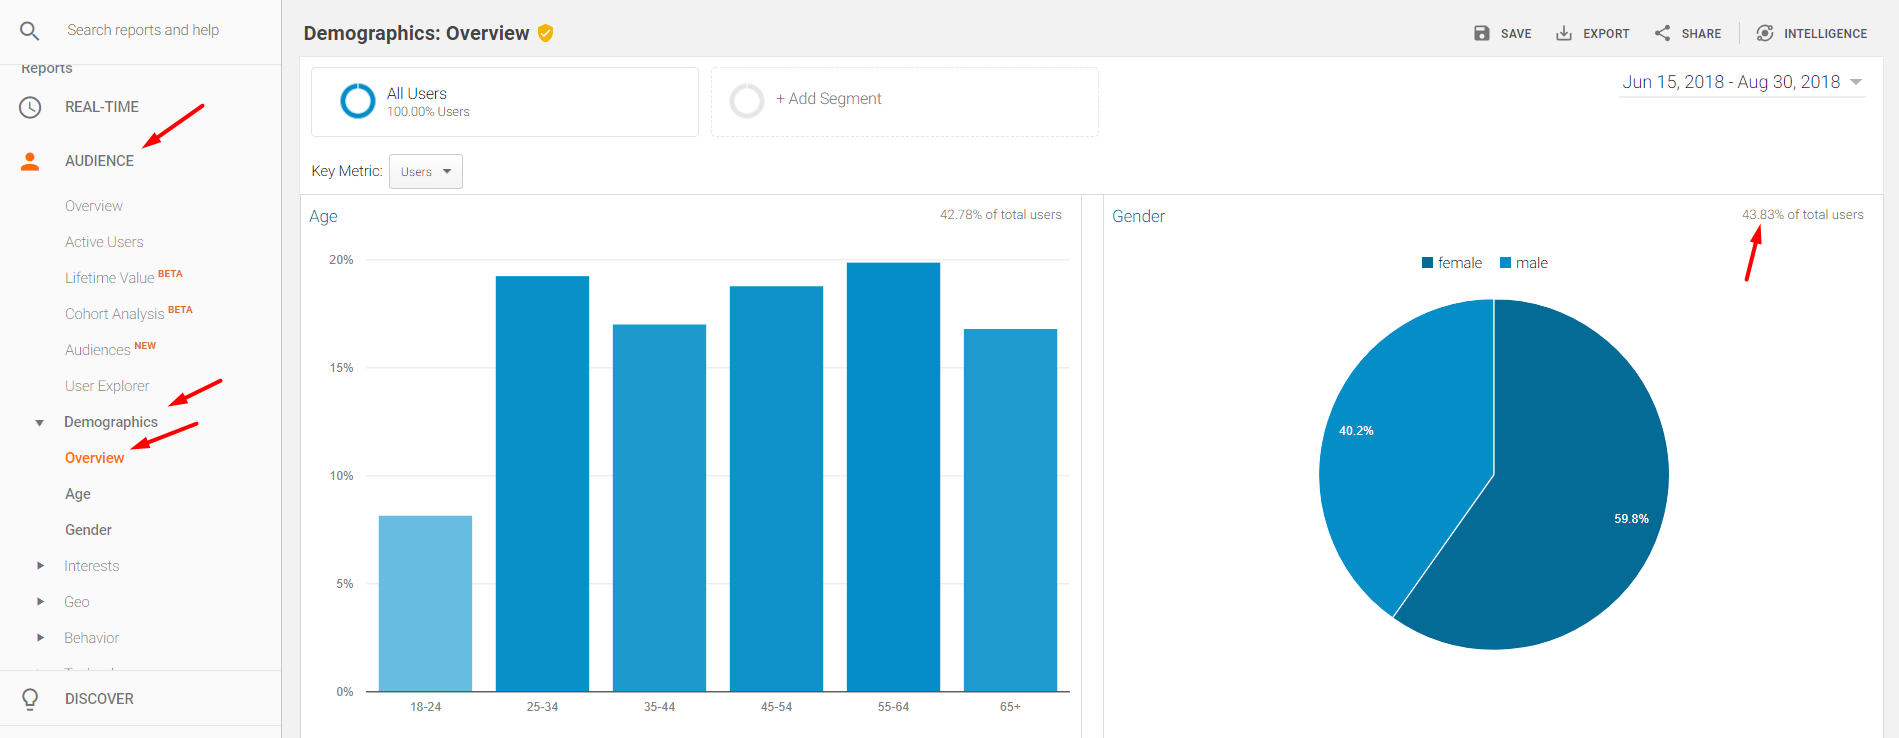
Audience Demographics Overview shows age and gender of visitors. But not all visitors are captured in the report — 43.83 percent are shown in this case. Click image to enlarge.
Break down the reporting by gender or age to identify which convert best. In the example below — at Audience Demographics Age — ages 55-64 and 65+ converted best, at 2.61 and 2.45 percent, respectively. If the target market were younger shoppers, the merchant should either change its strategy or align with the older demographic.
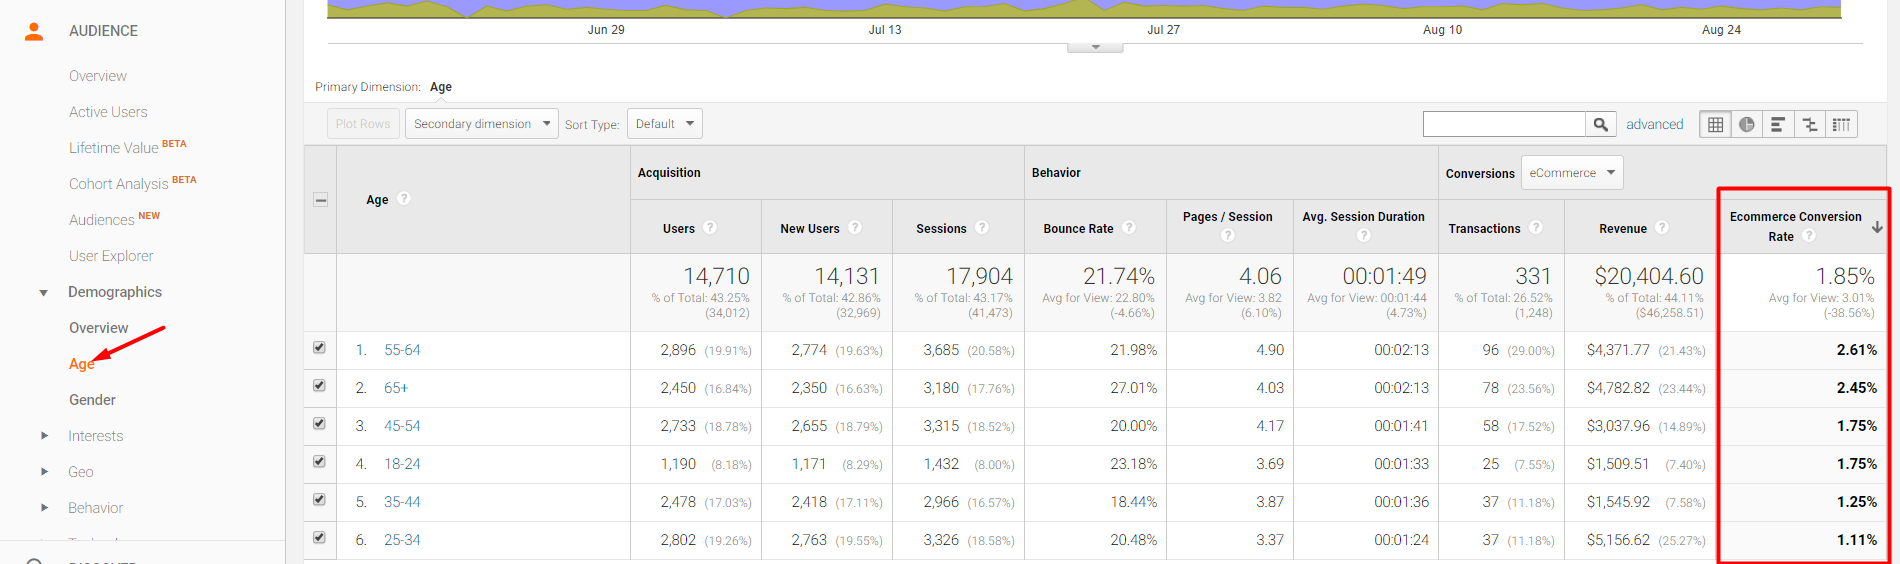
Ages 55-64 and 65+ converted best at 2.61 and 2.45 percent, respectively, as shown in the “Ecommerce Conversion Rate” column on the far right. Click image to enlarge.
If your target market is a certain region, use the Geo reports at Audience Geo Location to measure results as well as opportunities if certain regions are driving more traffic and conversions than expected.
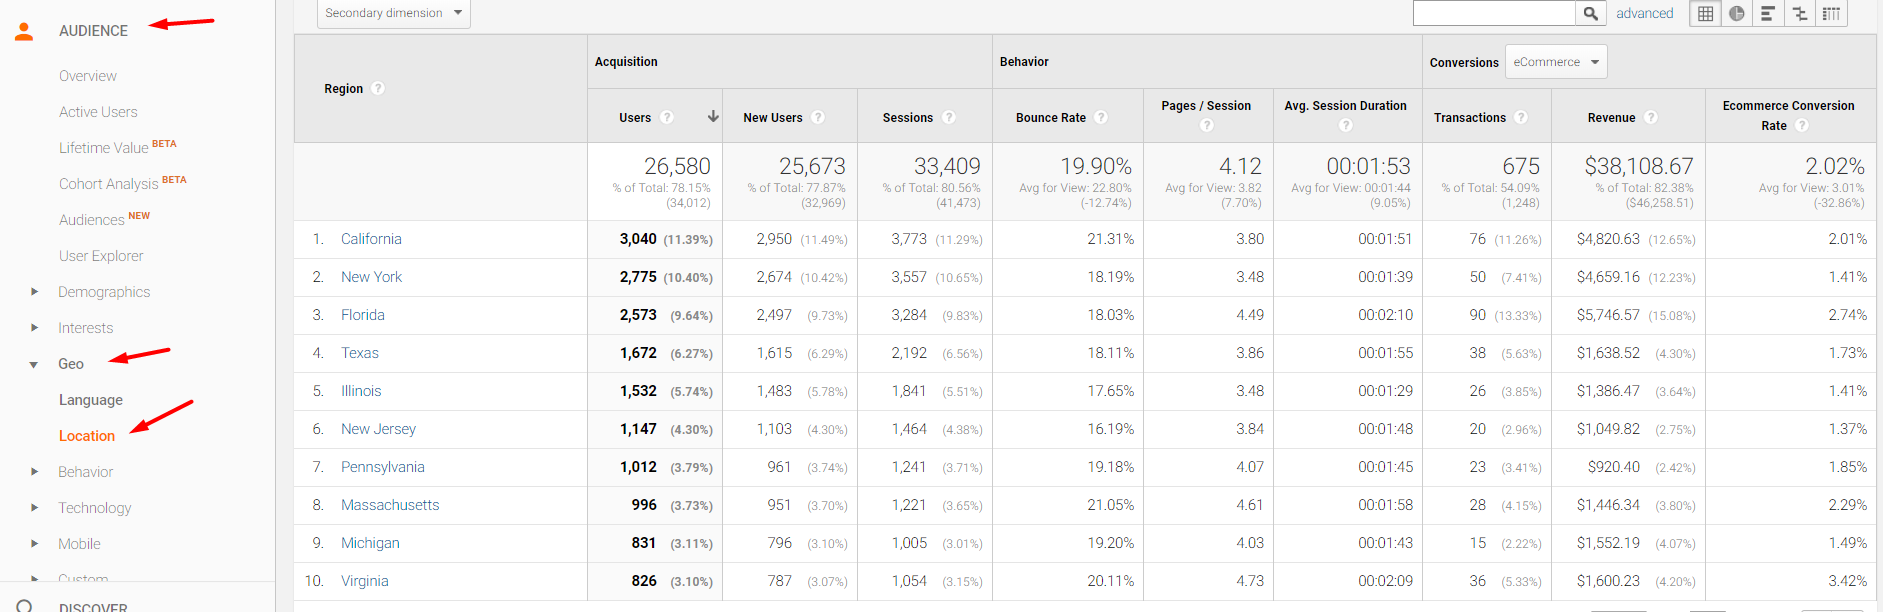
Reporting traffic and revenue by region (state) at Audience Geo Location. Click image to enlarge.
Learn more about your visitors by using the Interests report at Audience Interests Affinity Categories. Do the affinities align with your target market or value proposition? Should you adjust your strategy?
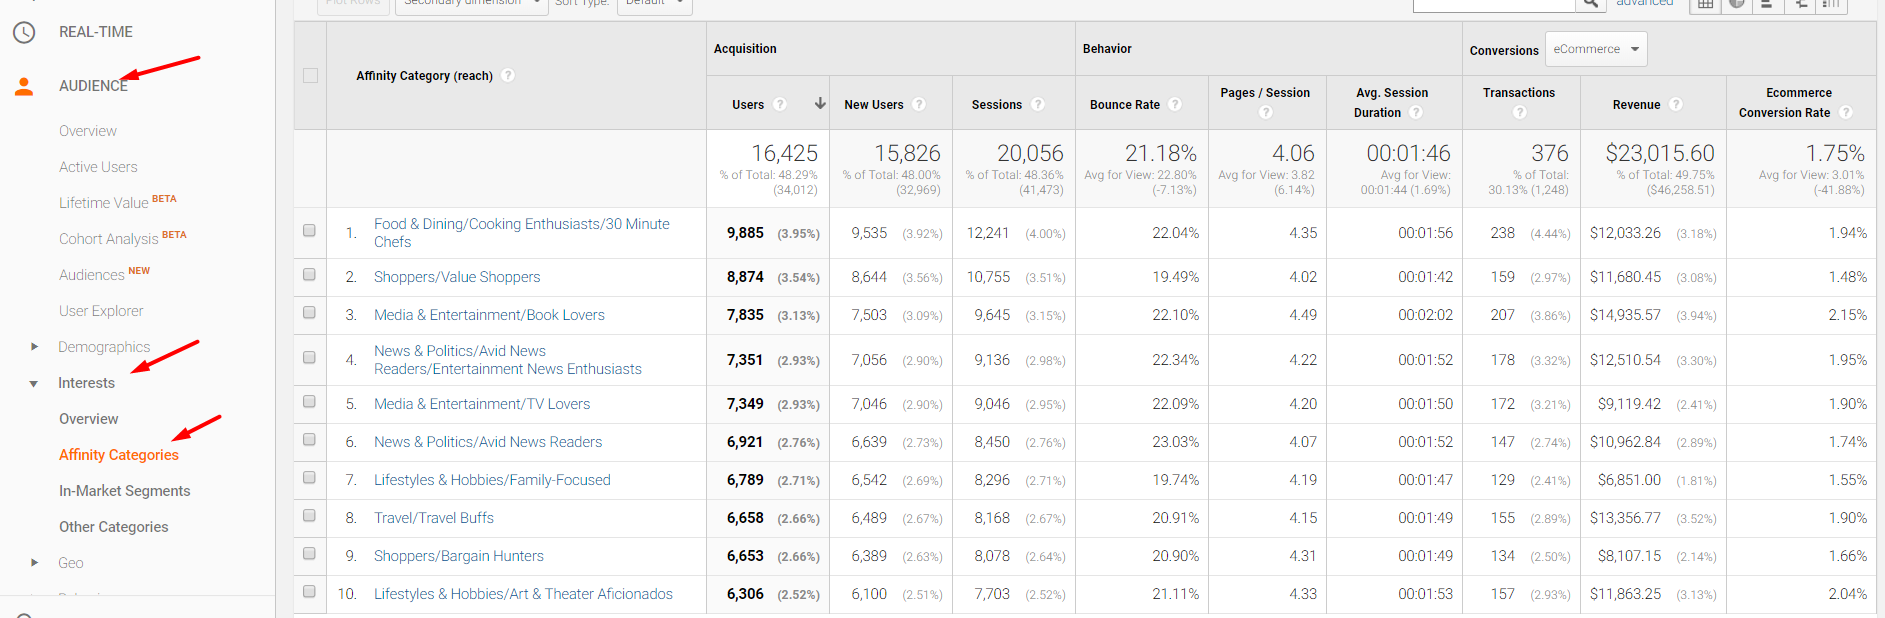
Learn more about your traffic and sales at Audience Interests Affinity Categories. Click image to enlarge.
If your value proposition is to build a connection with customers via Facebook and other channels, measure the effectiveness by reporting traffic and sales by channel at Acquisition All Traffic Channels. Do social sites generate a large percentage of traffic and sales? What about the conversion rate?
In the example below, in line 7, only 173 users came from social channels. No revenue (at far right column) came from social.
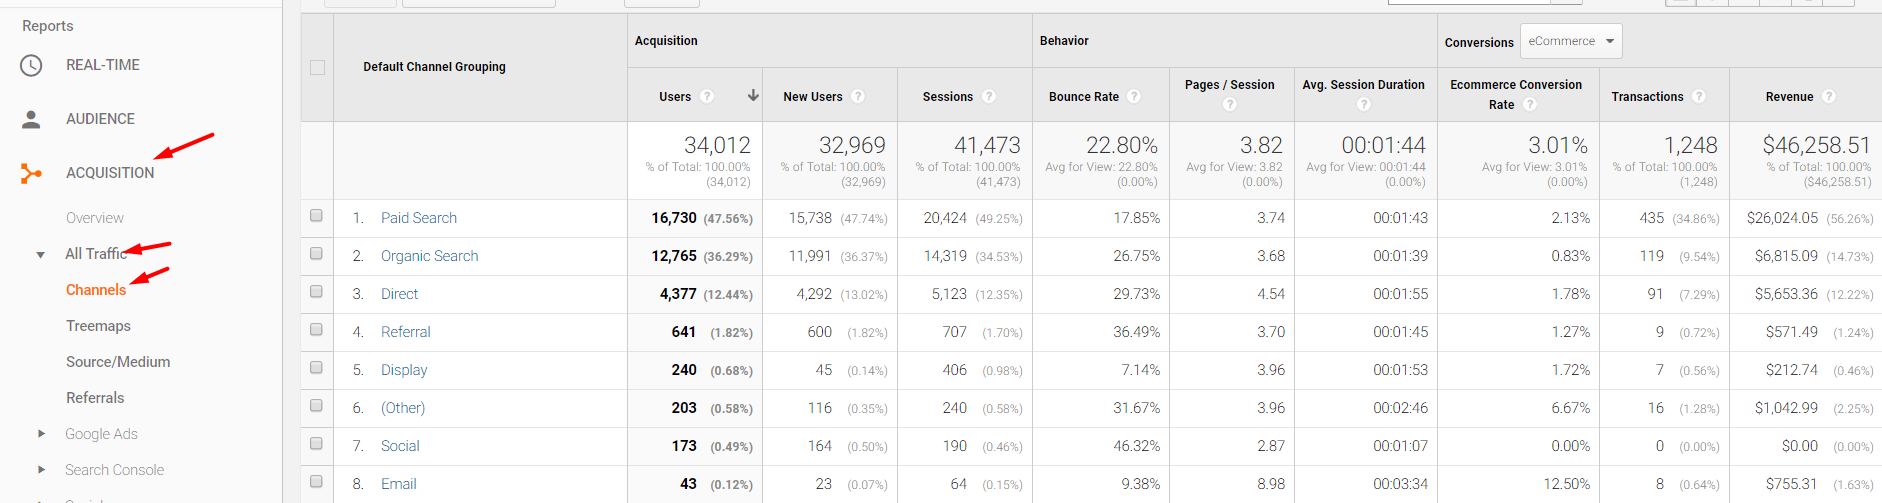
In line 7, only 173 users came from social channels. No revenue (at far right column) came from social. Click image to enlarge.
The Ultimate Feedback
Successful companies use data to change strategy or tactics to drive more revenue. Those companies accept that their initial assumptions were misguided. Thus, always use data. It is the ultimate feedback for continuous improvement.