Monitoring the navigation of visitors can help ecommerce merchants identify bottlenecks to the checkout page. There are two ways to analyze paths in Google Analytics: Behavior Flow and Navigation analysis.
Behavior Flow Reporting
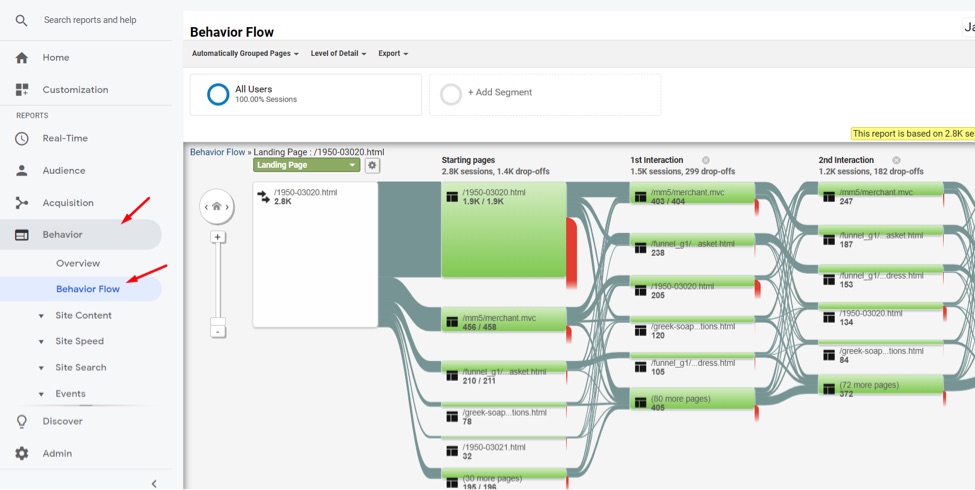
To view this reporting, go to Behavior Behavior Flow.
In Google Analytics, go to Behavior Behavior Flow. Click image to enlarge.
Behavior Flow reporting can be challenging to identify action opportunities. To simplify the reporting, focus on a single page to see where traffic is going afterward.
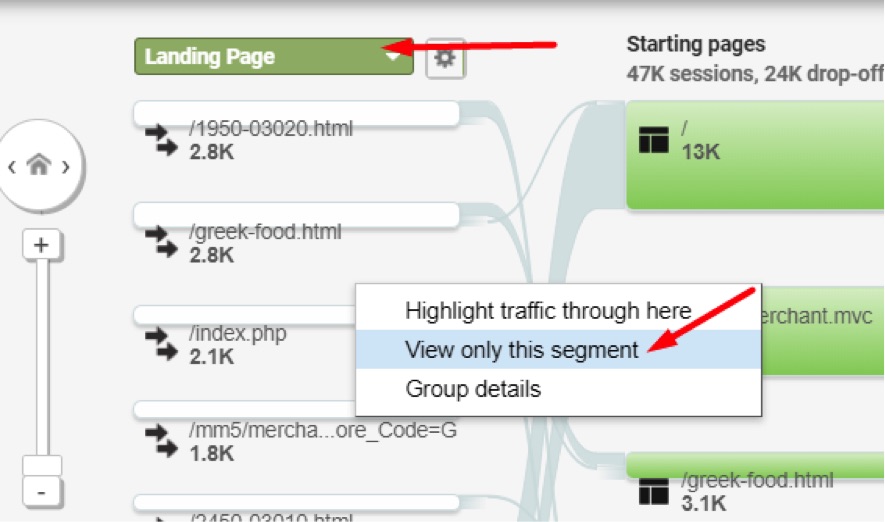
For example, say I want to focus on traffic that lands on my home page. I will search for that page (“/index.php” in the example below) in my list of “Landing Page” options and click “View only this segment.”
Search for the desired page in the list of “Landing Page” options and click “View only this segment.” Click image to enlarge.
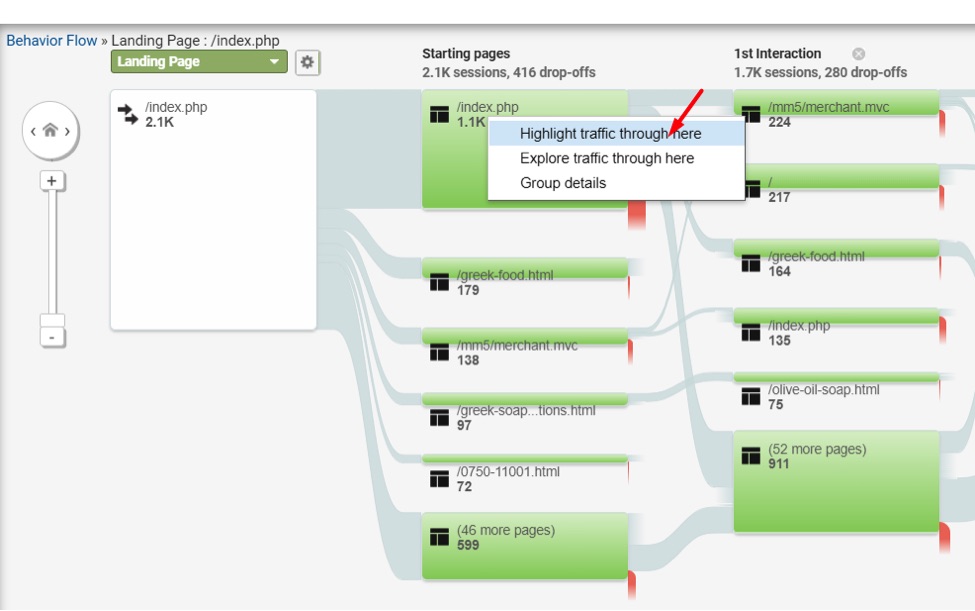
It can be confusing. You may see something similar to the screenshot below where the “Starting pages” column includes the home page and several other pages. That’s because the reporting identifies users across multiple sessions. The “Landing Page” reports the first page touched in visitors’ first session. The “Starting pages” reports the first page touched in the most recent sessions for visitors that touched the “Landing Page” in their first session.
The “Landing Page” reports the first page touched in users’ first session. The “Starting pages” reports the first page touched in the most recent sessions for visitors that touched the “Landing Page” in their first session. Click image to enlarge.
Once you get through this, you can focus (again) on the home page by clicking on “Highlight traffic through here.”
Focus on the home page by clicking on “Highlight traffic through here.” Click image to enlarge.
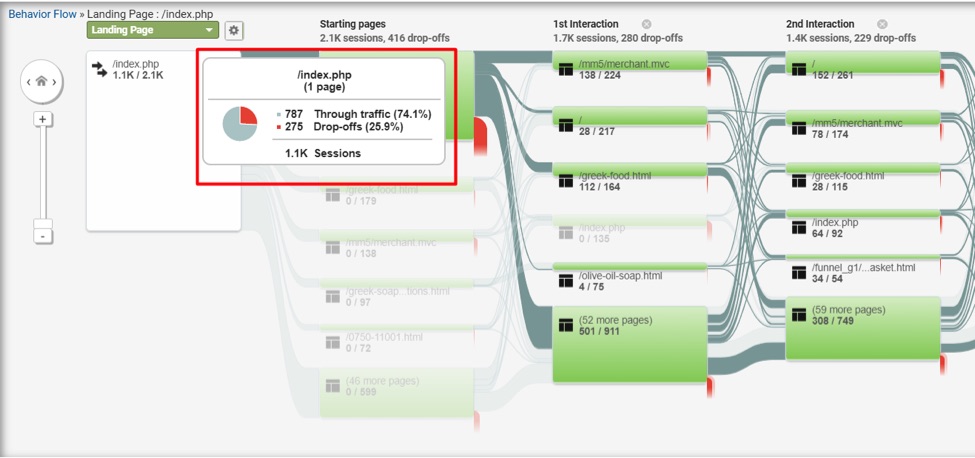
Hover over the home page reference to see how many sessions proceeded to other pages (screenshot below: “Through traffic 74.1%”) and how many sessions exited on that page (“Drop-offs 25.9%”). You can also view the “1st interaction” or next pages touched after the home page.
For my Greek foods ecommerce site, the top page clicked after landing on the home page is “/mm5/merchant.mvc,” which is the basket page. This was a surprise. I would not expect the checkout to be the top page after landing on the site.
From the home page, 74.1% of sessions proceeded to additional pages, while 25.9% exited. The top page clicked after landing on the home page is “/mm5/merchant.mvc,” which is the basket page. Click image to enlarge.
I spend very little time in Behavior Flow reporting because of the difficulty in isolating pages. There’s also too much information to drive focus. Nonetheless, explore this section and use Google’s help guides for more insights.
Navigation Analysis
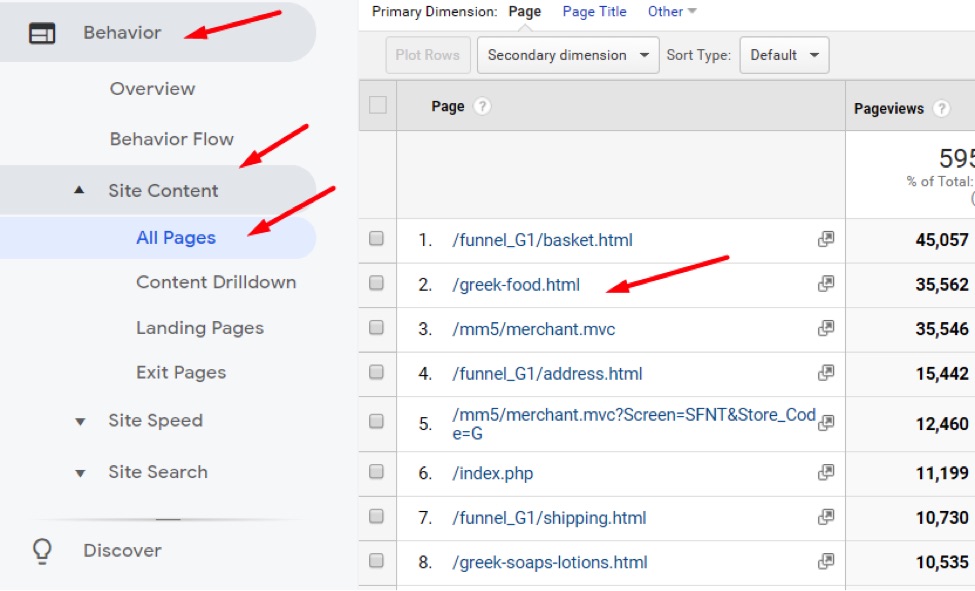
To view this reporting, go to Behavior Site Content All Pages and then click on a page. In the screenshot below, I’ve selected a main category page (“/greek-food.html”).
To view navigation paths, go to Behavior Site Content All Pages and then click on a page, such as “/greek-food.html,” a category page. Click image to enlarge.
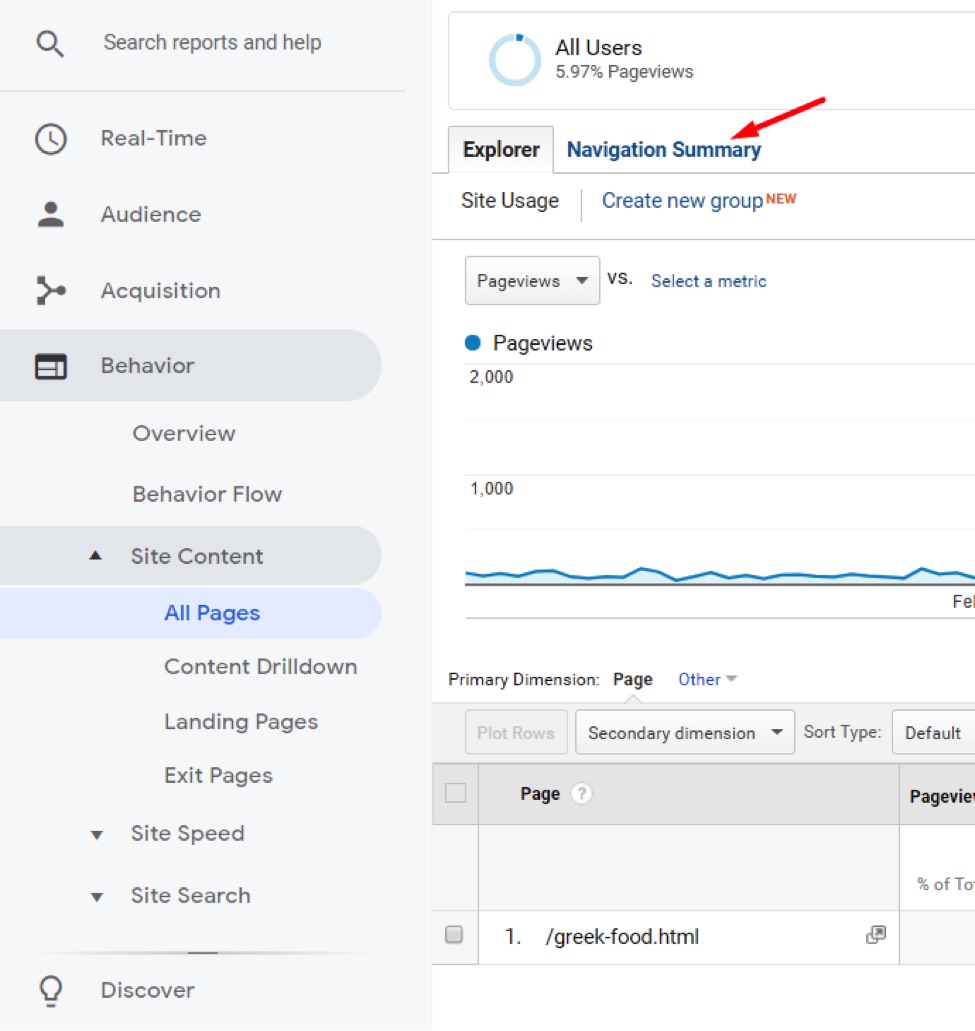
Then click on “Navigation summary” at the top of the report for that page.
“Navigation summary” at the top of the report for the desired page. Click image to enlarge.
You can now gather useful information, such as:
- Sessions entered on the page (8.32% in the example below).
- Sessions with previous pages (91.68%).
- Sessions exited on this page (5.88%).
- Sessions clicked to other pages after reaching this page (94.12%).
Analyze previous and next pages for visitor sessions. Click image to enlarge.
You can also view the top 10 pages visited before this page (“Previous Page Path”) and the top 10 pages visited after this page (“Next Page Path”).
Navigation analysis targets one page at a time. It is more focused than Behavior Flow reporting. It’s also simpler and easier to use.
Using navigation analysis for my “/greek-food.html” category page, I can ascertain:
- There are not many entrances (8.32% of all sessions that touch the page) for this main page of my website. I may want to search optimize this page to drive more traffic to it.
- There are not many exits from this page (5.88%), which is good!
- There is quite a bit of traffic to this page coming from the basket page and checkout (“/mm5/merchant.mvc”), which I would not expect.
- This page is doing a good job of funneling traffic into sub-category pages (“/greek-cheese.html,” “/greek-party-foods.html,” and others).
Prioritize
Focus on the pages that have the most impact on conversions. Then look at the impact pages with high exit rates. Look, also, at pages with the most overall views because those pages receive the most traffic and, potentially, the most exits.
Article source: https://www.practicalecommerce.com/analyze-click-paths-in-google-analytics-to-improve-conversions

